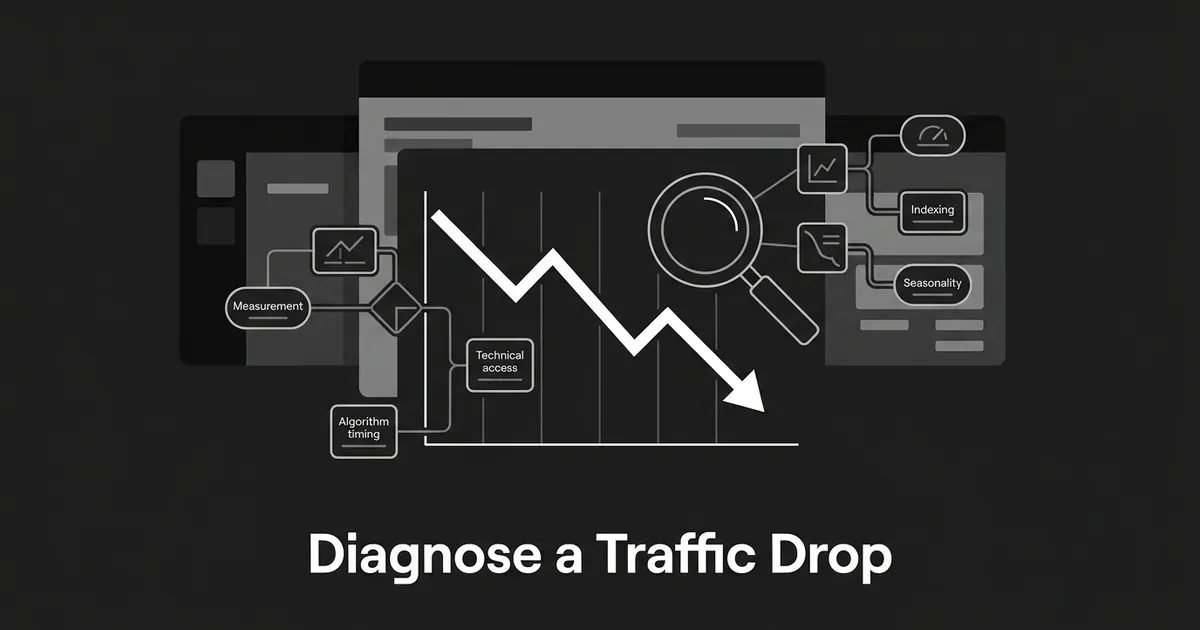
You open your dashboard and the line has dropped. Somewhere between last month and this one, organic traffic fell, and the chart by itself does not tell you why. That gap is the hard part. A chart shows you that something changed. It does not tell you whether the cause is a tracking error, a technical problem, a seasonal dip, a change to how Google ranks pages, or something in your content that stopped working. Before you can fix anything, you need to diagnose organic traffic drop causes in the right order, or you'll waste a week chasing the wrong one.
This guide gives you an organic traffic troubleshooting framework you can run every time you ask why did my traffic drop, in an order that rules out the easy explanations before you jump to the scary ones. You will work through eight steps using Google Search Console, moving from "is this even real" to "what do I do about it." By the end you will have a documented cause and a specific next check or fix, not just a guess.
What you will want on hand: access to the right Search Console property, your analytics tool for a quick cross-check, the date range where the drop happened, and a short list of anything that changed recently on the site: a deployment, a template update, a redirect, new content, or a hosting change.
Step 1: Confirm the drop is real before you touch anything
The first move when you diagnose organic traffic drop causes is to slow down and check whether you are even looking at the right thing. Search Console's Performance report measures Google Search specifically. It is not your total website traffic. If a dashboard pulling from paid, direct, email, or social channels is what triggered the alarm, you might be chasing an SEO problem that is not actually an SEO problem.
Before you interpret the chart at all, work through a short list:
- Open the correct Search Console property and check that it matches the site you're actually investigating, including the right URL version and scope.
- Exclude incomplete or very recent dates from your comparison. The newest days often carry preliminary data.
- Check the Data Anomalies page for a known reporting issue, a logging change, or another event that could create a dip that has nothing to do with your rankings.
- Pull up your analytics tool and see if the same pattern shows there. This is a cross-check, not a replacement. Search Console is still the source of truth for Google Search visibility.
- Write down the suspected start date, the suspected end date (or "still ongoing"), the search type affected, and which metric first caught your attention.
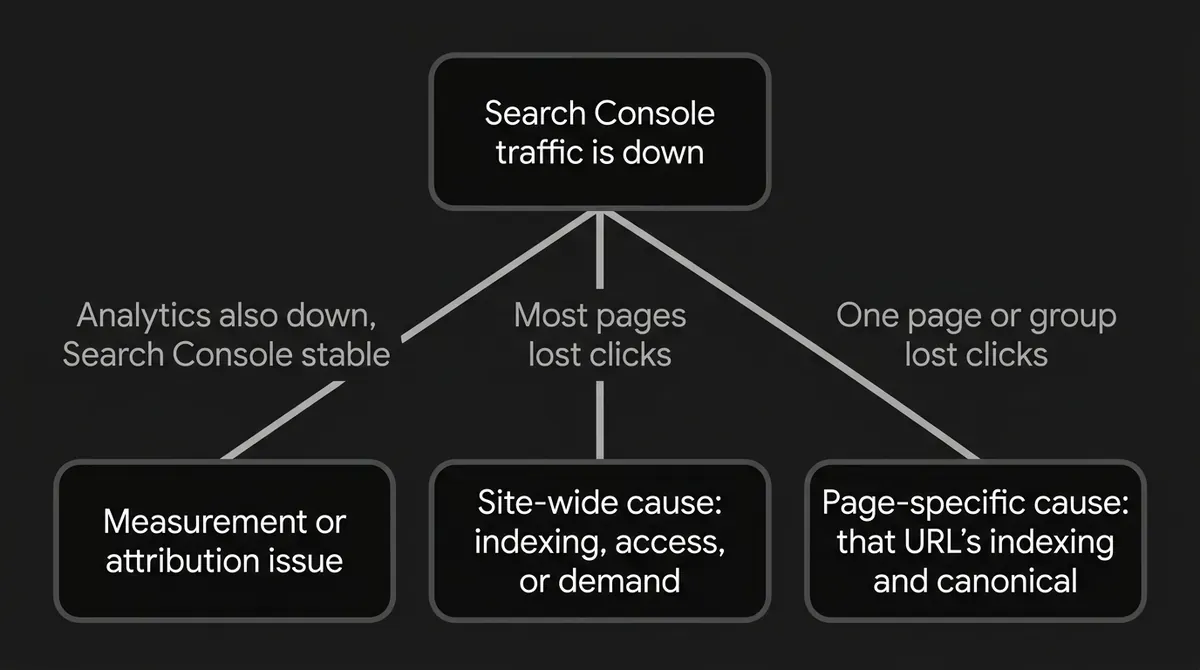
If your analytics tool shows a drop but Search Console looks stable, that's a strong hint you have a measurement or attribution problem, not a search visibility problem. Investigate your tracking setup before you touch anything on the SEO side. If both systems agree there's a decline, keep going through the rest of this framework.
Common mistake: don't declare a Google Search problem based on a total-traffic chart alone. Total traffic bundles in channels that have nothing to do with search rankings. Treat "traffic is down" as a symptom you still need to locate, not a diagnosis.
Step 2: Find exactly when the decline started
Once you know the drop is real, pin down its shape. Set your Search Console date range to the last 16 months. That wider window lets you spot whether this looks like a one-off event or part of a pattern that happens every year.
From there:
- Scan the chart for where the drop begins and, if it has already leveled off, where it ends.
- Narrow the date filter down to just the decline period.
- Use the Compare option to set that period against the one immediately before it, matched for length.
- Where you have enough data, also compare the same period one year earlier.
- Save or export that comparison so you have a fixed baseline to work from as you go through the rest of the steps.
Search Console generally shows dates in Pacific Time, and it only includes complete days by default, so the most recent stretch can look artificially low just because the data isn't finished coming in yet. A date range that starts or ends mid-week can also throw off a weekly or monthly view.
Pro tip: if you're not sure your window is clean, err on the side of a slightly narrower, fully complete range over a wider one that includes a few unfinished days. A false read here throws off everything downstream.
Common mistake: don't pick whichever comparison period happens to produce the biggest percentage drop. Match the length, the weekday pattern, and the season as closely as the data allows, or you'll be comparing two different things and calling it one story.
Step 3: Map the loss across pages, queries, and segments
Now you find out where the loss actually lives. Open the Pages table in the Performance report and compare your decline window against the baseline you saved in step 2. Sort by clicks difference to see which URLs lost the most.
A search console traffic drop almost always has a shape, and the pattern tells you where to look next:
- Most pages dropped by a similar amount: treat this as a site-wide issue and think indexing, access, demand, or a broad search change.
- One directory or template dropped: look at what those pages share. A shared template, a shared internal-linking pattern, or a shared canonical setup is usually the thread.
- One important page dropped on its own: pull that URL through URL Inspection and look at its indexing, canonical, and query history specifically.
- A small number of pages account for most of the loss: resist the urge to make a site-wide change before you understand those pages.
Then walk through the other dimensions in order: queries (which searches lost clicks or impressions), countries (is this limited to a market), devices (desktop, mobile, or tablet), search appearance (did a particular result type change), search type (Web, Images, Video, News), and dates (does it line up with a launch or a recurring period). If the loss is concentrated in one country, that points toward international targeting or hreflang. If it's one device, look at your responsive templates and page experience. If it's Images or Video, that's a different investigation than Web Search rankings.
Pay attention to which metric actually moved. Clicks and impressions both down together usually means visibility, demand, or access changed. Impressions down with position shifting points toward demand, competition, or content relevance. Impressions holding steady while clicks fall is more about how the result looks in search (title, snippet, competing listings) than about ranking, and that's a deeper investigation on its own.
Search Console's numbers aren't a perfect raw log, either. Some queries are hidden to protect user privacy. The table shows only the most significant rows, not every query. Performance is usually credited to whichever URL Google picked as canonical, which might not be the exact page a visitor landed on. Keep that in mind before you treat the table as gospel down to the URL.
Common mistake: don't let the average position chart carry the whole diagnosis. It's an aggregate, and it moves when your query mix changes, not just when individual rankings do. Read it alongside pages, queries, clicks, and impressions, never alone.
Step 4: Rule out seasonality and demand shifts
Before you change a single page, check whether people simply searched for this topic less. Go back to your 16-month chart and compare the affected period with the same period a year earlier. Look for a pattern tied to a holiday, a school calendar, a weather season, an industry cycle, or a recurring event.
Break the loss down by query and country while you're at it. A real demand shift usually shows up across a whole cluster of related queries or an entire market, not one isolated page. Cross-check the affected topics in Google Trends, matched to the right geography and time window, and look at interest in the topic itself rather than just your brand name.
How you read the result:
- Search Console and topic interest both declining together: seasonality or demand is a believable explanation.
- Topic interest holding steady while only your pages fall: keep investigating indexing, technical access, competitors, and content.
- The same dip shows up around the same time every year: log it as a recurring pattern, not an SEO incident.
- The decline is limited to one market: compare demand for that specific country before assuming it's a site-wide problem.
Common mistake: don't call something "seasonal" off a single year-over-year comparison if your business, your offer, or your audience has changed since last year. Seasonality only holds up as an explanation when the timing and the affected queries actually support it.
Step 5: Check indexing and page-level access
If the drop looks site-wide, start with the Page Indexing report. If it's concentrated on a group of pages or a single URL, go straight to URL Inspection on representative examples.
In the Page Indexing report, check whether your indexed-page count dropped around the same time as your traffic. Look for spikes in non-indexed URLs, errors, and warnings, then open the most relevant reason in the "why pages aren't indexed" breakdown. Check the source value: a website-caused issue is one you can typically fix, while a Google-side reason is not. Pull a few example URLs from that category into URL Inspection and look at the crawl and indexing detail, using Test Live URL when the indexed version might be stale. Once you've fixed a genuine issue, request Validate Fix and give it time to run.
Some statuses worth knowing on sight: a server error (5xx) means Google hit a problem on your end; a redirect error means a loop or an overly long chain; blocked by robots.txt means the crawler was told not to fetch the page; marked noindex means Google saw the page and was told not to index it; a soft 404 looks like a not-found page without returning one; crawled but not indexed means Google looked and chose not to include it, and resubmitting isn't automatically the fix.
Not every one of these is a problem. Some duplicate URLs, redirects, and intentionally noindexed pages are supposed to be excluded. The question that matters is whether your important pages are indexed and eligible to show up, not whether every URL Google knows about is indexed.
Robots.txt and noindex do different jobs, and mixing them up causes real damage. Robots.txt manages whether a crawler can fetch a page at all. Noindex tells Google not to include a page it has already crawled. If you block a page in robots.txt, Google may never see the noindex tag sitting on it, because it never gets to read the page. When you're debugging, look for a recently broadened robots rule, a noindex tag showing up somewhere it shouldn't, a template condition applying noindex to a whole section by accident, or a blocked script, stylesheet, or image that keeps the page from rendering the way it should.
Also check what Google picked as the canonical version of a page. If it chose something other than what you intended, that's worth investigating through duplicate content, internal links, and your canonical signals, but a canonical mismatch on its own isn't automatically harmful. What matters is whether the version you want to rank is indexed and showing up.
Common mistake: don't try to "fix" every excluded URL you find. Plenty of exclusions, duplicates, redirects, and intentionally noindexed pages, are working exactly as intended. Reserve your effort for statuses that touch important pages or actually explain the traffic you lost. Validation and reindexing after a real fix typically takes a week or two, sometimes longer, so give it time before you check again.
Step 6: Check crawling, server access, and recent changes
Crawl Stats is your next stop, especially if the drop hit a lot of pages at once or lines up with a hosting change, a deployment, or a DNS update. It's built for a technical read of how Google has been crawling your site.
Walk through it in order: host status (you want to see green), whether robots.txt is being fetched successfully, whether DNS resolved consistently, whether your server responded without timing out, the mix of successful responses versus redirects, client errors, and server errors, any unusual shift in the types of files Google is requesting, whether it's mostly discovering new URLs or refreshing known ones, and how the recent crawl rate compares to the week or two before.
A sudden fall in crawl rate often traces back to a broad robots.txt change, a slow server, or a spike in server errors. Google tends to back off requesting pages from a site that's struggling to respond, as a way of not making things worse. That said, a lower crawl rate on its own doesn't prove your rankings dropped. It's a clue, not a verdict.
Line up anything notable here against your deployment history, uptime monitoring, and any recent CDN, DNS, or hosting change. If you have access to raw server logs, they're a useful supporting check: which bots hit which URLs, how often, and what response they got. Treat that as backup evidence, not a replacement for what Search Console is telling you.
Common mistake: don't treat a lower crawl count by itself as some kind of penalty. First figure out whether Google actually ran into access or response problems, and whether the affected URLs overlap with the pages that lost traffic.
Step 7: Rule out manual actions, security issues, and removals
Before you start blaming an algorithm change, check the reports that give you a direct answer.
Open Manual Actions. If Google flagged a policy or quality issue on your site, it shows up here with the specific issue, the pages or sections affected, and what to do about it. If you find one, read the exact description, identify the scope, follow the remediation steps, and only submit a reconsideration request once you've actually fixed the issue. A clean Manual Actions report doesn't rule out everything else, it just rules out this one explanation.
Open Security Issues next. This flags signs that your site may have been compromised in a way that could put visitors at risk: injected content, unexpected redirects, or malicious scripts. If something shows up here, treat it as an incident and work through Google's remediation steps rather than trying to fix it as an ordinary content problem.
Run a quick site-restricted or branded search as a sanity check. It can surface a removal request that's hiding pages you didn't expect, a section that got accidentally deindexed, a recent domain or URL structure change, or a mismatch between the property you're reviewing and the site that's actually live. Keep in mind that a recent fix or a new page might not show up right away simply because Google hasn't recrawled it yet.
Common mistake: don't label a large drop a "Google penalty" just because it's big. A manual action shows up explicitly in its own report. Everything else, algorithm changes, technical issues, demand shifts, or measurement problems, needs its own evidence, not a hunch based on the size of the drop.
Step 8: Weigh algorithm timing and decide your next move
This is the last check, not the first one, and that order matters. Only get here once you've worked through measurement, timing, page and query mapping, seasonality, indexing, crawling, and the direct-answer reports above.
Check the Google Search Status Dashboard for a core or spam update that lines up with your timing. Confirm the rollout has actually finished, then wait at least a full week after that before you draw your main comparison. Look at the pages and queries that were hit hardest, and keep Web Search, Images, Video, and News separate rather than blending them together. Distinguish a small position shift from a large, sustained one. If the drop is large and hasn't recovered, take an honest look at whether the affected pages are genuinely helpful, reliable, and clear, and whether they serve the reader's need as well as what's now outranking them.
If what you find is a small movement, resist making big changes to pages that were already doing fine. If it's a large, sustained shift, look at the site and the hardest-hit pages as a whole, and if you can, get an outside opinion on whether the content actually holds up. Skip the quick fixes based on rumors about a specific ranking factor. Focus on changes that genuinely make the page easier to understand and use. Deleting content should be your last resort, not your first move, reserved for pages that truly can't be salvaged.
By this point you should be able to write a conclusion like this: the decline began on this date, affects this scope, shows up in these metrics, is or isn't explained by demand, and does or doesn't line up with a technical, indexing, security, manual-action, or algorithm event. The next action is this specific check or fix, and you'll remeasure after the appropriate window has passed. Say "correlates with," not "was caused by," unless the timing, scope, and ruled-out alternatives actually support that stronger claim.
If your investigation lands on a content or coverage gap rather than a technical or algorithmic cause, that's a different kind of problem to solve, and it's worth knowing what you're comparing against. DeepSmith's Content Map maps your site and your competitors' sites onto one shared set of topics, so you can see where you're thin relative to what's ranking around you, not just guess at it. Its Opportunity Agents can turn that into a specific, evidence-backed list of pages worth building or strengthening. Neither one tells you why a specific day's traffic dropped, that's still a Search Console job, but they're a reasonable next step once you know the cause is content, not access.
Common mistake: don't reach for "the update did this" before you've ruled out indexing, access, seasonality, and reporting anomalies. An update that happens to land near your drop is a correlation until the rest of the evidence backs it up.
What to do next
Save this page as your seo traffic decline checklist, because the next time the chart dips you'll want the same organic traffic troubleshooting framework, not a fresh guess. Keep the record you built along the way: the dates, the affected pages and queries, what you ruled out, and what you fixed. Apply only the fix the evidence actually points to, and give it the right amount of time before you check again, a week or two for a reindexing fix, a full week past rollout for an algorithm question, and longer for a broader content improvement. If the cause turns out to be a content gap rather than a technical one, that's when it's worth building or strengthening the pages that are missing, and DeepSmith's Content Studio can take a planned piece from research through a brand-grounded draft, internal linking, and publishing in one pass. You can try it free for seven days if that's the stage you're at.