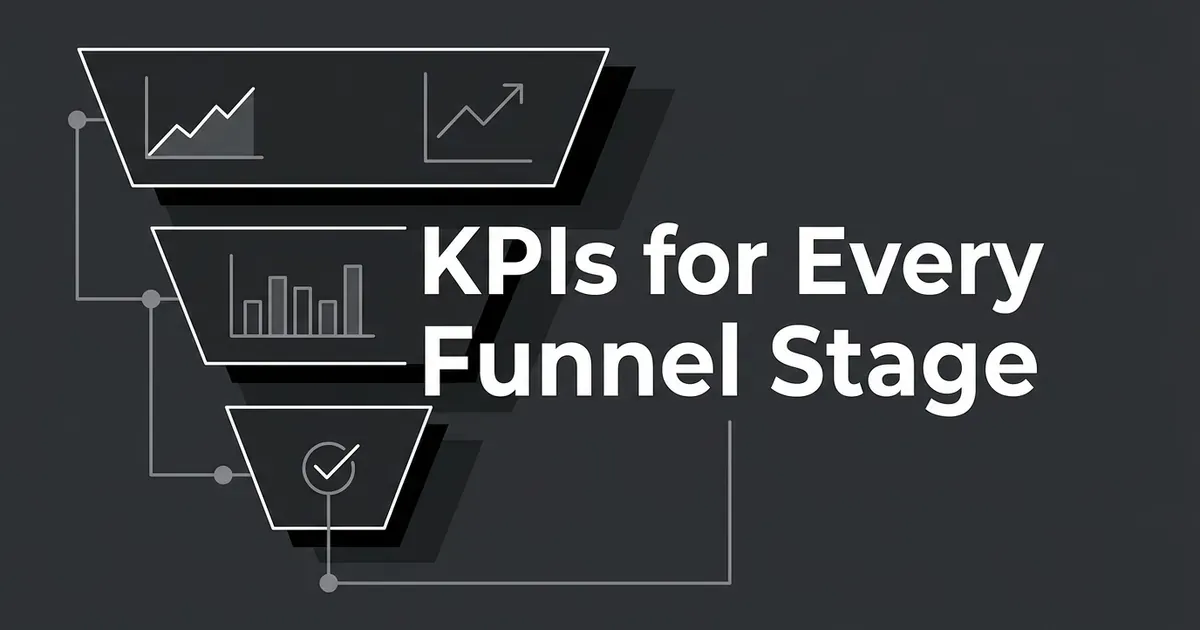
The content marketing KPIs that matter at each funnel stage are relevant reach and traffic at awareness, meaningful engagement and validated lead capture at consideration, and high-intent conversions plus lead qualification at decision. Each one should be tied to the next action the content is supposed to support. When a report puts all of these in one column, a traffic number ends up standing in for lead quality, and a form fill ends up standing in for a sale.
This article walks through the three stages one at a time, so you can pick a primary measure for each group of content and stop judging a top-of-funnel article by the same yardstick as a quote-request page.
What makes a content metric a useful KPI?
A metric is a number you can measure. A KPI is a metric you have picked to judge progress against a specific goal. Page views are a metric. Landing sessions from the audience you meant to reach can become a KPI, but only when discovery is the goal for that piece.
That means the label depends on the decision the number supports, and it doesn't depend on how commercial the number sounds. A conversion metric isn't automatically a better KPI for every article. An introductory post that was written to help someone understand a problem will look weak if you grade it on enquiries, even though it may be doing its job well.
Two other distinctions help before you build anything.
First, a funnel stage describes the job a piece of content was written to do. It doesn't tell you the state of every person who reads it. A buyer who is nearly ready can come back to an introductory article, and someone who is still researching can read a detailed case study. Format doesn't set the stage either, since a blog post, a video, a webinar or a case study can serve different jobs depending on the subject and the next step you want.
Second, a content funnel is not a CRM lifecycle. A funnel groups what your content is trying to do. A lifecycle records the defined state of a contact or company. They can be connected, but someone doesn't become a marketing qualified lead (MQL) because your analytics tool tagged the page they read as consideration content. Qualification needs your own written criteria and a recorded contact.
A simple way to hold all this together is three layers for every group of content:
- A primary KPI, which answers whether the content did its main job.
- A quality guardrail, which answers whether the result was meaningful and not just large.
- A progression signal, which answers whether readers took the next step you intended.
This is a suggested reporting structure, and you can simplify it. What matters is that volume, quality and progress stay visible as three different things.
The stage mapping below is a recommended synthesis. No industry body has defined a single correct rule that puts each metric in exactly one stage, so treat it as a starting point you can adjust.
How the content KPIs by funnel stage fit together
Here is the whole content marketing metrics framework in one table. The sections after it explain each row.
| Stage | Content's job | Primary KPI | Quality or progression check | What does not prove success on its own |
|---|---|---|---|---|
| Awareness | Bring relevant people into contact with the topic and brand | Content landing sessions from the intended channels and topics | Engagement rate or a next-step click | Raw impressions, unsegmented traffic |
| Consideration, ungated | Help readers understand options and keep evaluating | Completion of a meaningful next step, such as a move to a relevant guide or case study | Engaged sessions and useful continued exploration | Time on page or scroll depth alone |
| Consideration, lead capture | Create an identifiable relationship through a relevant offer | Validated new leads and the completion rate of the chosen capture action | Share of the same lead cohort that reaches your MQL definition | Treating every download or signup as an MQL |
| Decision | Support a high-intent commercial action | Validated quote requests, consultation bookings or equivalent enquiries, plus completion rate | Qualified responses and sales acceptance | CTA clicks, generic engagement, low-intent form fills |
The two consideration rows are alternative paths inside one stage, and they are not extra stages. Pick the one that matches what the content is for. A useful ungated explanation doesn't need a form to have measurable value.
Awareness: are the right readers finding the content?
Awareness content succeeds when it reaches people for whom the subject matters and gives them a useful first visit. Traffic and reach are the right measures at this stage. They only become a problem when a report uses them as evidence of lead quality or purchase intent.
Top of funnel content metrics worth tracking
Content landing sessions count the visits that begin on a particular article or content group. They answer whether that content pulls people into your site, which is usually the question at this stage.
Users help when you care about audience breadth, but say which user measure you mean, since total, active and new users aren't interchangeable. New users don't prove each one is a genuinely new person, because identification and consent settings affect what the tool can recognize.
For search, Search Console gives you four separate numbers. Impressions are how often your site appeared in results. Clicks are how often someone clicked through. CTR is clicks divided by impressions. Average position is the average position of your topmost result. Impressions show search exposure and clicks show arrival from search, while CTR helps you see the relationship between the two. Average position is a diagnostic about search performance. It doesn't tell you readers understood the page or became leads.
What makes traffic relevant?
Relevant traffic isn't a built-in metric in any analytics tool. You define it by the things you can observe: the topic, the landing page, the channel, the campaign, the query group, the language or the market the content was meant to serve.
Web analytics can't verify a visitor's job title, company fit or buying authority, so relevance inferred from channels and topics is different from lead fit confirmed in a CRM.
The guardrail and next-step signal
Pair reach with an engagement check, so a rise in traffic doesn't automatically get reported as a win. A next-step click shows whether the introduction made going further look worthwhile.
Two readings come up often. If impressions rise while clicks stay flat, search exposure grew but arrivals didn't, so look at the search context before calling it lead growth. If traffic rises while engagement drops, the audience, channel mix or promise may have changed, and that is a hypothesis to test.
Low enquiry volume on an awareness article isn't enough to say it failed, and a big traffic number isn't enough to say it helped the people you wanted to reach. If you want to go deeper on the traffic question specifically, there's a separate look at whether organic traffic is a vanity metric.
Consideration: are readers engaging and taking a meaningful next step?
Consideration content succeeds when readers spend real attention understanding their options and then take a sensible next step. Engagement is useful evidence here, but it isn't a qualification decision.
Engaged sessions and engagement rate
Under Google's definition for GA4, a session counts as engaged if it meets at least one of three conditions: it lasts longer than 10 seconds, it has a key event, or it has at least two page or screen views. Engagement rate is the percentage of sessions that were engaged, and bounce rate is the percentage that weren't.
Because those conditions are alternatives, a session can be engaged through a key event or a second page view without anyone reading for long, so engagement rate isn't a reading-completion rate. GA4 also defines a bounce as a non-engaged session, so someone can view one page and still have an engaged session.
Changes to how events are configured can shift these numbers too, so keep the measurement rules steady before you compare one period with another.
Engagement time
GA4's user engagement measures the time a page was in focus, which is more specific than leaving a tab open. It still doesn't prove comprehension or intent. A long time can mean careful reading or trouble finding the answer, and a short time can mean the reader left or got a quick answer. Keep GA4's own metric names as they are, since average engagement time and average session duration aren't synonyms. If you're curious how much time on page matters for rankings, there's a piece on whether dwell time affects rankings.
Progress on ungated content
For a practical guide or an educational comparison, a relevant next step might be opening a deeper explanation, moving to a case study that matches the reader's problem, visiting an enquiry page after weighing up an approach, or clicking a clearly labeled call to action.
These are custom measures that you define, and they aren't built-in GA4 metrics. You have to decide the event and who is eligible for it. A second page view isn't automatically progress either. The destination and the intended journey are what count.
When the content is built to capture leads
If the purpose of a piece is to build a relationship, use validated lead records and the rate at which eligible visitors finish the action you chose. Keep four things separate:
- A form event is a recorded interaction on your website.
- A lead is an identifiable record under your own definition.
- A new lead is different from an existing contact who submitted another form.
- A qualified lead meets extra criteria you've agreed on.
A resource click may show interest, and it still isn't automatically a new lead. A newsletter signup can be a valuable audience relationship without being a sales-ready response.
Decision: is the content producing qualified, high-intent responses?
Decision content succeeds when it helps suitable people complete a specific commercial action. Good measures include validated quote requests, booked consultations and enquiries that describe a real need.
Name the action in your report. A column labeled only "conversions" can combine very different things, such as a newsletter signup and a quote request.
Completion is stronger than a click
A CTA click shows an attempt to proceed. A form start shows someone entered the response process. A successful, validated completion shows the action happened. Those are three different points and they shouldn't be counted as equal outcomes.
Form-start and completion numbers help you understand where people drop out of the process. A recorded submit event still doesn't prove the details were valid, delivery succeeded or the lead is usable, so confirm the outcome in your form system or CRM before you report it as qualified demand.
Qualification and acceptance
HubSpot's default lifecycle definitions show how these terms can be spelled out. A subscriber opted in to a blog or newsletter, a lead converted beyond a subscription signup, an MQL is marketing qualified as ready for sales, and an SQL is sales qualified as a potential customer. Those labels can be customized, so they're a reference and not a rule.
A qualification framework should separate behavior from fit. A resource download can show interest, while company characteristics decide whether the response is suitable. Your documented marketing and sales agreement should decide what gets reported as an MQL, because published descriptions of readiness vary.
Sales acceptance is a helpful limited check on lead quality. Where you record it, report whether submitted leads met the agreed minimum and were accepted for follow-up. Acceptance isn't a purchase, so keep it as a downstream quality check.
How should these stages appear in one report?
The simplest rule is to segment before you summarize. Group content by its intended funnel job and compare like with like. An awareness article, an ungated evaluation guide and a quote-request page shouldn't be judged through one conversion column.
For each group, keep enough context that a number can be read later: the intended stage, the objective and next action, the primary count and rate, the quality guardrail, the channel and period, the counting unit and denominator, and the source or attribution rule.
If you'd like to compare different ways of structuring stages in the first place, there's a piece on funnel, flywheel and buyer's journey models. There's another on mapping buyer stages across a topic cluster.
Entry and exposure are different counts
Content landing sessions tell you whether an asset attracts people into the site. Sessions that included the asset tell you whether it was seen during a visit. Pick the one that fits your claim, and label it accurately.
Sourced and assisted outcomes
Decide your source rule before you say content generated a lead. It could refer to the conversion asset, to an acquisition interaction or to another agreed rule, and these aren't interchangeable.
An assisted outcome means content appeared in a recorded converting journey. It doesn't prove the content caused the conversion. A reader may touch several assets before completing one action, so if you add up each page's assisted count and call the total unique leads, you will overcount. Deduplicate for any program-level total. Attribution tools assign credit under models and with the interactions they can see, which makes credit a reporting convention and not an experiment.
Use cohorts to measure qualification
For lead-to-MQL performance, start with a defined group of leads and follow them through a stated window. MQLs created this month describe qualification activity during the month, while the share of one month's new leads that later became MQLs describes that cohort, so don't divide one by the other unless the populations match. No universal window comes out of the sources behind this article, so state the one you chose.
A worked example with made-up numbers
These values are hypothetical and exist only to show the reading. They aren't benchmarks or customer results.
| Content group | Hypothetical observations | How to read it |
|---|---|---|
| Awareness articles | 10,000 landing sessions, 6,200 engaged sessions, 600 sessions with a specified next-step click | Engagement rate is 62% and next-step click rate is 6%. These describe attention and progression, not qualified leads. |
| Consideration resource | 2,000 eligible landing sessions, 160 sessions with a validated lead-capture action, 160 distinct new valid leads | Selected-action session rate is 8%, with 160 leads under the stated counting rule. |
| That consideration cohort, later | 48 of those 160 leads reach the agreed MQL state within a 30-day window | Cohort lead-to-MQL rate is 30%. The 30-day window is just an illustration. |
| Decision content | 500 eligible sessions, 25 sessions with validated requests, 15 accepted and 10 rejected | Request completion rate is 5% and acceptance among reviewed requests is 60%. |
The 62%, 8% and 5% figures aren't scores you can rank, because they measure different actions against different populations. They are also separate content groups, so don't read them as a path from 10,000 readers to 160 leads to 25 requests, and don't calculate one overall funnel conversion from them. The consideration resource shouldn't be called a success on its 160 leads alone, since the cohort result supplies the quality check.
Where do content KPIs become misleading?
Most reporting problems come from a handful of habits. Here are the ones worth watching for.
Treating traffic as a vanity metric by default. Traffic gets called vanity when it's cut off from the goal, or when it's used to suggest outcomes it doesn't measure. For awareness content, relevant traffic can be exactly the right primary KPI. The useful split is between a metric that fits its purpose and one that's being misapplied.
Assuming more time or more pages is always better. Long engagement can mean thorough reading or difficulty, and more pages can mean relevant exploration or confusion.
Collapsing a download into an MQL. A file-link click, a form submission, a new lead and an MQL are different events or records. Folding them together inflates reports and hides whether the content attracts suitable people.
Relying on email opens. Apple Mail Privacy Protection preloads tracking pixels even when nobody opened the message, so opens can be inflated. Clicks are a stronger signal, though automated activity can still affect them.
Expecting analytics tools to match exactly. Search Console describes search exposure and clicks, and analytics describes measured site activity. They use different units and collection methods, so small gaps are normal. Search Console also leaves out rare queries for privacy, so chart totals can exceed the sum of the visible table rows.
Treating a measured funnel as the whole journey. GA4 funnel exploration counts users who complete specified steps in a defined order. That is useful for one process, and it isn't proof that every buyer moves through awareness, consideration and decision pages in that order.
What should you do before the next report?
Pick a few content groups, assign each one a primary measure and a next-step signal, and write down the counting rule for both. That's enough to make the next report easier to read. If you want a place to start on the lean end, there's a piece on the metrics that matter when you publish four posts a month. There's one on measuring blog performance.