If you have ever added up the clicks in your Search Console query table and gotten a smaller number than the chart at the top of the page, you are not imagining it. Google withholds the exact search term behind a click whenever that term was searched by too few people to protect the searcher's privacy, and it can still count the click in your totals while hiding the word itself. This is what people mean by gsc anonymized queries, and it is the same thing a lot of marketers still call not provided search terms out of habit from older analytics tools. Depending on your site, it can account for a large share of your organic traffic.
What an anonymized query actually is
Google's own term for this is anonymized queries. Anonymized queries and not provided search terms describe the same hidden search console data, just from two different eras of analytics language. An anonymized query is one that was not typed by more than a few dozen users over a two to three month window. Google does not publish an exact number, and it does not say the rule is only about how long or unusual a phrase is. It is a frequency rule tied to privacy: if showing you the exact words someone searched would make it too easy to guess who that person was, Google withholds the words.
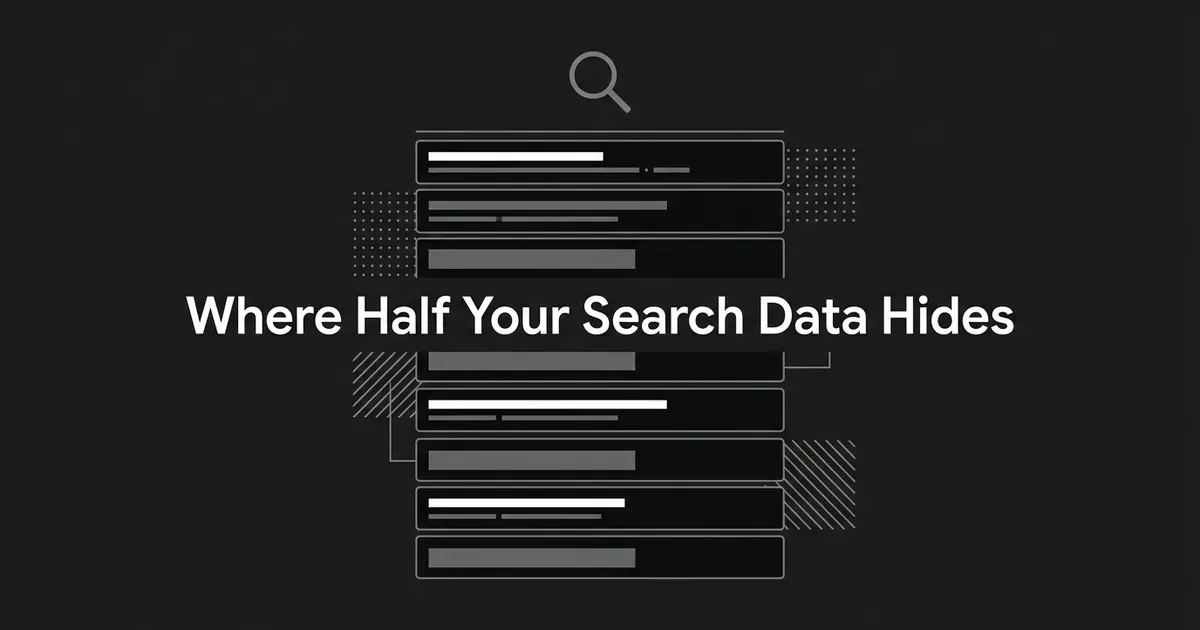
In your Performance report, that hidden query shows up as a blank row. It is easy to read a blank as "nobody searched anything," but that is not what happened. The click or impression is real, and Google may still be counting it in your overall numbers. What is missing is only the text of the search term, not the event itself. Treat every blank as a placeholder for a real visit whose wording you are not allowed to see, not as an empty result.
The kinds of searches that tend to fall into this bucket are the ones you would expect: a long, oddly phrased question, a very specific product or part number, a niche professional term, a branded phrase used in an unusual way, or wording that touches something personal. None of that means the search was suspicious or that your tracking is broken. It just means too few people typed those exact words for Google to show them to you.
Why the gap shows up in your reports
The confusing part is not that some queries are hidden. It is that the hidden ones still affect numbers you are trying to reconcile. Google has said plainly that anonymized queries are left out of the query table but can still be part of the totals shown in your performance chart, unless you apply a query filter. So if your chart says 550 clicks for the period and your visible query rows only add up to 450, the other 100 are not lost. They belong to searches Google has chosen not to name.

This gets worse once you start filtering. A filter like "queries containing" a certain word only looks at the visible query values. It has no access to the hidden bucket at all. So two filtered groups, one for queries with a term and one without, can add up to your visible-query total and still fall short of your unfiltered chart total, because the anonymized clicks were never part of either group to begin with. If you have ever tried to reconcile filtered segments and come up short, this is very likely why. These search console query gaps are the most common reason a filtered report and an unfiltered one never quite line up.
There is a second, unrelated reason your numbers might not match, and it is worth keeping separate in your head. Search Console also truncates data because of its own storage and processing limits, meaning it does not always show every visible row either. Anonymization is Google choosing to protect a searcher. Truncation is the interface choosing not to display every low-volume row it has. Both can shrink your query table, but only one of them is a privacy decision, and treating them as the same thing will lead you to the wrong explanation when you are debugging a mismatch.
This hidden search console data behavior is consistent across every way you access it, not just the report you happen to be looking at. It is a different problem from Search Console's ceiling on AI-visibility reporting, but both come from the same fact: the interface only shows you what Google decides to expose. None of this is unique to the interface. The Search Analytics API returns visible query rows too, not a special row that reveals the anonymized text, and it comes with its own limits: 1,000 rows by default, up to 25,000 per call, and a ceiling of 50,000 rows a day per search type. Pulling more rows through the API gets you more of what is already visible. It cannot surface a query Google has decided to withhold.
What the "nearly half" figure is measuring
The number that gets repeated most often, close to half of all queries, comes from Ahrefs, which examined roughly 22 billion clicks across more than 887,000 Search Console properties in April 2025 and found that clicks tied to anonymized queries made up 46.77 percent of the total. That figure has been fairly steady for years: Ahrefs measured 46.08 percent in 2022 and 45.02 percent in an April 2024 pull. So the "nearly half" pattern is not new, and it is not a sign that something recently changed on Google's end.
What that statistic is not is a rule you can apply to your own property. Ahrefs also found that the most common anonymization rate for an individual site sat somewhere between 45 and 80 percent, and that both very small and very large sites tended to have more hidden data than sites with middling traffic. Your own percentage depends on your topic, your audience, and how much of your traffic comes from long, specific, one-off questions versus repeated, navigational searches. A site full of branded searches for its own name will look nothing like a site built on niche how-to content, even though both are affected by the same underlying rule.
It also helps to be precise about what the study actually measured. It counted clicks in a large sample, not a percentage of unique query strings, and it is not proof of exactly how a searcher's frequency threshold works inside Google's systems. Ahrefs has suggested that longer, more conversational searches may push the anonymized share higher over time, which is a reasonable guess given how people now phrase questions, but it is an interpretation of the data rather than a published Google rule. Hold the 46.77 percent figure as a useful sense of scale, not as a number your own dashboard should be expected to match.
Why this changes how you should read organic traffic
Once you accept the organic traffic analysis limitations that come with a partial query table, the honest thing to do is change what kind of claim you make from it. With full query data, you could say a page got its clicks from these exact terms. With anonymization built in, the more accurate statement is that a page received a mix of visible queries and unlisted low-frequency ones, and that the page, device, country, and search-appearance data around those clicks tell you the likely context even when the words do not.
These organic traffic analysis limitations matter most for keyword-level reporting. If you are building a list of "our top organic keywords" straight from the query table, you are working from a partial list and should say so, especially on pages that draw a lot of long-tail or highly specific searches. It does not mean the page-level numbers are wrong. Search Console still reports clicks and impressions by page, country, device, date, and search appearance regardless of whether the underlying query is visible, and those dimensions hold up even when the exact wording does not.
Working around these search console query gaps is mostly a matter of knowing which questions the remaining data can still answer.
How to work with the gap instead of around it
None of the following recovers a hidden query. What it does is stop you from mistaking a partial table for a complete one and give you a more honest read on the traffic you can see.
Start by quantifying the gap for yourself. Using the same property, date range, and search type, compare your unfiltered chart total against the sum of your visible query rows, without any query filter applied. The difference is a reasonable estimate of your unlisted-click volume, though some of it may also reflect ordinary row truncation rather than anonymization alone, so treat it as directional rather than exact.
Lean on page-level reporting when the query itself is not available. A landing page's title, headings, and existing content still tell you a lot about the intent behind the traffic it receives, even for the share of clicks whose exact wording you cannot see. This is also where a broader look at your content gaps pays off, because a page attracting steady organic clicks with a thin visible-query list is often a page worth reviewing for coverage rather than one you can assume is fully understood.
Segment by country and device before you give up on a page. Traffic concentrated in one market or one device type can tell you something useful about intent and audience even without the search term attached, and it is one of the few views where the anonymized clicks are counted alongside the visible ones rather than excluded.
Use Google Analytics for what happens after the click, not as a way to recover the term itself. Search Console tells you what happened on the way in from Google Search. Analytics tells you what a visitor did once they landed. The two use different counting methods and will rarely match exactly, and no amount of cross-referencing between them will reveal a query Google chose not to show you. If you want a clean read on how much of your traffic is coming from AI-driven search rather than classic organic clicks, the same discipline applies: measuring that in GA4 takes its own setup, separate from anything Search Console can tell you about a hidden query, and picking the tools built to catch AI referral traffic is its own research project on top of that.
Your SEO keyword list and any AI-prompt tracking you run are answering two different questions, so keep that boundary in mind here too. Treat outside keyword data as a hypothesis, not proof. Rank trackers, customer language, and your own site search can all suggest themes that never show up in your visible query table. They are useful for generating ideas about what people might be searching, but none of them can confirm that a specific hidden query produced a specific Search Console click. Keeping that distinction clear, between what you observed, what you inferred from the page, and what you are only guessing at from another source, is what keeps a report honest.
If your team is already spending real time reconciling this kind of mismatch by hand, it is worth stepping back and asking whether the manual work of checking coverage gaps, cross-referencing pages, and deciding what to write next should really be taking as long as it does. DeepSmith's Content Map builds a live picture of your own site's topic coverage from your sitemap, not from the query table, which sidesteps the anonymization problem entirely when you are trying to find where your content is thin. You can try DeepSmith free for 7 days to see whether it changes how much time this kind of analysis actually takes.
The bulk data export through BigQuery is worth knowing about if you are doing this kind of analysis often. It gives you a daily export of your Search Console data without the API's row limits, which is genuinely useful for aggregating over long periods or building a repeatable pipeline. It is still filtered for privacy the same way everything else is, so it widens your access to visible data without touching the anonymized portion.
Working through gsc anonymized queries this way, rather than trying to explain away every blank row, is what keeps the rest of your reporting trustworthy. The point of all of this is not to chase a complete keyword list that does not exist. It is to know which of your conclusions are solid, based on page, device, country, and visible-query data, and which ones you are inferring because the exact words are private by design. A site's tracking is not broken because a chunk of its queries are blank. That blank is Google doing exactly what it says it does.