
Traffic is down on a handful of pages and you are not sure why. Was it the algorithm? A sold-out SKU? A slow season? Here is the good news: an ecommerce content audit answers that question, and you do not need a data team to run one. This guide walks you through auditing product, category, and blog pages so you finish with a short, evidence-backed list of ecommerce decaying pages and the reason each one is on it.
One thing to set straight before we start. This is a diagnosis guide. You will collect proof, not make delete-or-rewrite calls. That decision belongs to a later step, and mixing the two is what turns a clean audit into a mess.
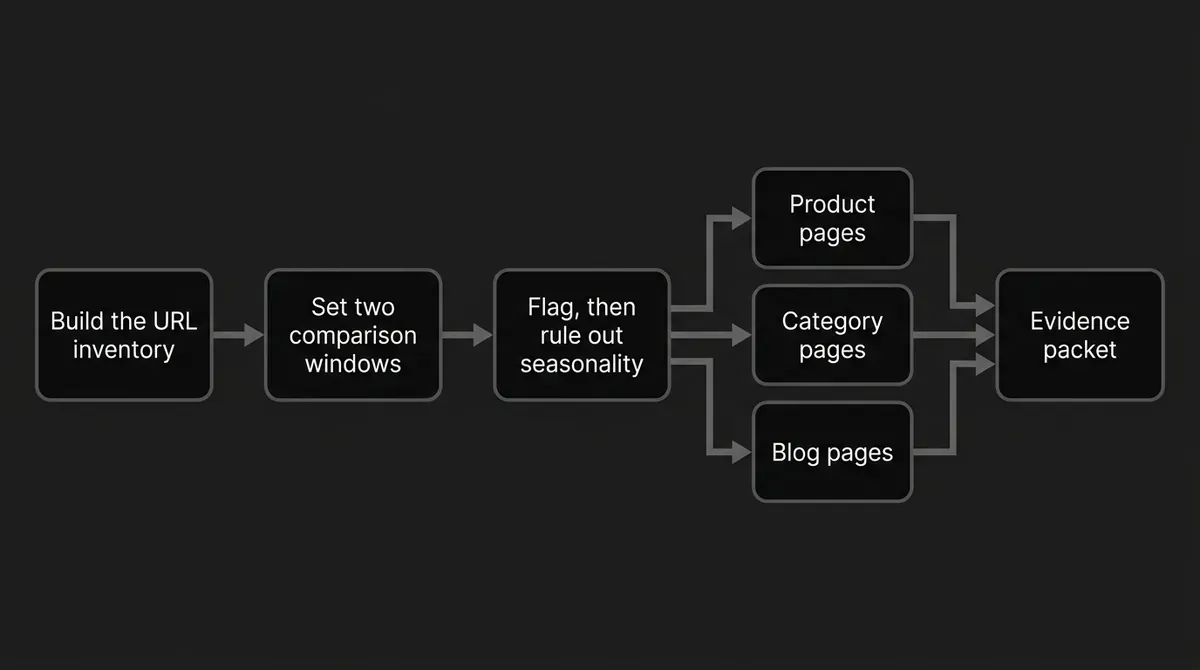
Step 1: Build one list of every product, category, and blog URL
Start with your XML sitemaps, your catalog or CMS export, and your blog index. Pull them into one sheet. Then label every row with a page type: product, category, or blog.
Add a few columns before you look at any performance data:
- URL and canonical URL
- Page type, plus SKU, parent SKU, category, or blog topic
- Indexability and HTTP status
- Stock state: in stock, out of stock, preorder, backorder, discontinued, or unknown
- Price, currency, and last catalog or content change
- Category product count, and whether the page is empty
- Season or campaign tag: holiday, summer, back-to-school, or evergreen
- Primary query or topic, funnel intent, internal links in and out
- Whether the URL is a normal page, a variant, a filter, a sort, a search result, or pagination
Do not lean on the sitemap alone. Google uses your internal links to understand how a store fits together, and the normal path is menu to category to subcategory to product. If products are not linked from category pages, crawlers may never find them. So add a crawl export, and a Merchant Center product list where you have one.
You know this step is done when every canonical URL has exactly one row, a page type, and a known or explicitly unknown stock state. Variants, facets, and non-canonical URLs sit in their own labeled group instead of quietly padding your page count.
Common mistake: auditing only the blog sitemap. That is the easiest export to get, and it leaves out the two page types where most of your revenue lives.
Keeping that page-and-topic map current is where DeepSmith's Content Map helps. It crawls your site and your competitors' sitemaps, sorts every page onto a topic and a funnel stage, and rechecks those sitemaps every 24 hours, so new pages fold in on their own. It will not read your stock status or your analytics. That part stays yours.
Step 2: Set your comparison windows before you look at a single number
This is the step people skip, and it is the one that saves you a week of chasing ghosts. Pick your windows first. Otherwise you will pick the range that confirms whatever you already suspect.
Google Search Console is where an online store content audit gets its search data. Record clicks, impressions, click-through rate, and average position for each page. Those four metrics are the whole report. Break them down by page, query, device, country, and date when it helps, and keep brand and non-brand queries in separate columns. A brand-demand dip should never look like a ranking loss.
Two habits worth building. Weekly or monthly aggregation smooths out weekends and holidays. Daily data is noisy, and the newest days are preliminary, so treat a fresh dip carefully. The default report view is the last three months, and the date range is yours to change.
Then use Google Analytics 4 to check organic landing-page sessions, engaged sessions, and conversions. If your store sends ecommerce events, follow product-level behavior too: item views, add-to-cart, checkout, purchase, refund. GA4 groups products into item arrays, with up to 200 items in a single event, so consistent item and transaction IDs matter more than you would think.
Now the windows. Use two, not one:
- Detection: the last 28 days against the previous 28 days.
- Validation: the last 90 days against the same period last year.
Adjust for the page in front of you. Low-volume pages need a longer window, around 56 days, so a handful of clicks does not set off an alarm. Fast-moving topics can use 7 days against the prior 7, lined up on matching weekdays and read with caution. Stable evergreen pages do well against a rolling 12-month baseline. If a page has campaign spikes, a rolling median beats a plain average every time.
You know this step is done when every URL has a current window, a comparison window, sample sizes, and a note saying which kind of comparison it is.
Step 3: Flag your candidates with thresholds you can defend
Take a breath here. There is no official number at which a page becomes decayed. Anyone who tells you 20% is a Google rule is guessing. What exists is practical operating guidance, and it is genuinely useful as a starting setting.
Here is what published guidance suggests:
- Ahrefs recommends reviewing quarterly and flagging pages that are down more than 20% year over year.
- UserGrowth suggests alerting when clicks fall 30% or more from a 28-day baseline for two weeks running.
- UserGrowth also uses CTR down 25% or more while position moves less than 0.5, and average position down by 2 or more for queries with at least 100 impressions in the last 28 days.
- Roughly 200 impressions or 100 sessions per window is a sensible minimum sample. Below that, extend the window and mark the finding low-confidence.
Start there, then calibrate to your own store. A 30% click drop on a page earning 40 clicks a month is noise. The same drop on a page earning 4,000 clicks is your afternoon.
Now read the pattern, not just the size of the fall:
| What you see | What to investigate first |
|---|---|
| Impressions and clicks both fall | Classic visibility loss. Still check season, stock, indexing, and competitors. |
| Impressions fall, CTR rises | Look at demand and lost queries before you blame the snippet. |
| Impressions flat, CTR falls | SERP features, title or snippet mismatch, price or availability display, softer intent. |
| Position worsens, impressions flat | Competitive loss or a query-mix change, more than a demand collapse. |
| Clicks fall, analytics sessions do not | Check filters, attribution, redirects, tracking, landing-page mapping. |
| Visits fall, purchases or assisted conversions hold | The page may still be pulling its weight. Record the gap. |
Pro tip: make every candidate pass two tests, not one. A meaningful change for its traffic level, and a plausible ecommerce explanation. A threshold on its own just hands you a long list of false positives.
Sort your flags into four buckets: candidate, seasonal candidate, technical candidate, and insufficient data. This is the spine of an online store content audit. Four buckets beat one pile of ecommerce decaying pages, because each bucket goes to a different check next.
Step 4: Rule out seasonality before you call it decay
Your catalog has a rhythm. Winter coats, garden tools, gift guides. A page can fall 60% and be perfectly healthy.
Work through this in order:
- Compare the current period with the same calendar period last year.
- Compare the full query mix, not one keyword: impressions, clicks, CTR, position, conversions.
- Check an outside demand signal, like Google Trends or a category demand report.
- Look at several related products or categories, not one URL on its own.
- Check whether the wider market fell at the same time.
- Look for a deployment, stock change, price change, or competitor move that lines up with the drop.
A dip that shows up at the same time every year is probably seasonal. A dip with no twin in last year's chart deserves a real investigation. And here is the useful contrast: if a whole category's demand fell, that points away from a page problem. If one page fell while its category held steady, that points straight at the page.
Common mistake: stopping at "it is seasonal" and closing the tab. Seasonality hides things. A page can be in its normal annual low and have lost its canonical, dropped out of the index, or gone out of stock at the same time. Check both.
You know this step is done when every candidate carries one of three labels: recurring seasonal pattern, new or unexplained decline, or mixed signal.
Step 5: Audit product pages for stock, variants, and stale facts
Product page decay rarely starts with the words on the page. It is the one page type where the copy is often the last thing at fault. It usually starts with the state of the product. So split your product candidates by inventory first: temporarily unavailable, preorder, backorder, seasonal, or discontinued. Those are four different problems wearing the same costume.
For each candidate, walk this list:
- Does the page clearly say in stock, out of stock, preorder, or backorder?
- Does the buy button agree with that state?
- Do the feed, the product structured data, the checkout, and the visible page all say the same thing?
- Are price, currency, product name, variant, shipping, returns, ratings, and reviews current?
- Does the page still answer its product query better than the pages beating it?
- Do near-duplicate variant descriptions leave each variant with nothing of its own?
- Are the canonical and variant URLs set up on purpose, and consistently?
- Is the page still getting organic traffic, product views, add-to-carts, purchases, or assisted conversions?
- If it is unavailable, does it point shoppers to alternatives or capture a back-in-stock request?
Google Merchant Center requires an availability value, and it has to match your site. The recognized states are in stock, out of stock, preorder, and backorder, and a preorder or backorder should show an expected shipping date. An out-of-stock state needs to be visible in the text or through a disabled buy control. A product you no longer sell should not be labeled temporarily out of stock. Merchant Center does offer a pause of up to 14 days for something coming back fast, but that is a feed setting, not a decay verdict.
Product structured data can describe price, availability, reviews, ratings, shipping, returns, and variants. Being eligible for a search enhancement is not a promise that one appears, so do not read eligibility as performance.
Common product page decay patterns:
- Visibility and stock fall together. Availability led, not copy.
- Traffic steady, CTR falling. Price, availability, reviews, or snippet is losing the click.
- Traffic steady, purchase rate falling. Check price, stock, variant selection, shipping, returns, and measurement before you touch the copy.
- One variant falls, the parent holds. Look at variant indexability, canonicals, inventory, and query fit.
- Product and its category fall together. Look at category demand, internal links, and sitewide changes.
Common mistake: treating every out-of-stock product as a decayed page, and measuring only last-click sales. Plenty of shoppers land on a sold-out page and buy something else. Those assisted conversions are real, and a page that quietly drives them is not a page to write off.
Step 6: Audit category pages for thin copy, empty grids, and filter sprawl
Judge a category as a landing page, not a bucket of links. Does it have a clear purpose, a matching title and heading, copy that actually explains the category, a working product grid, real product counts, and links to related subcategories?
Let's clear up the word-count question, because it wastes so much time. There is no authoritative minimum for category copy. None. A category page is thin when its copy is boilerplate, repeats a sibling category, or explains nothing beyond a grid that changes without warning. Short and specific beats long and padded.
Category page decay usually shows up as one of these:
- Impressions and clicks fall while category demand stays flat.
- The product count shrinks, or hits zero.
- The query mix drifts away from the category's intent.
- Copy, headings, product order, filters, or internal links changed right before the drop.
- Several near-identical categories are fighting over the same queries.
- The category is reachable only through an internal search box or a click-driven interaction.
- Filter and sort combinations have spawned URLs with nothing unique on them.
- A zero-result filter or an empty category is still crawlable and still looks like a real page.
That last group is worth real attention. Google says facet combinations can create duplicate content, dilute your signals, and burn crawl activity. Build discoverable links only for combinations that actually have products. Keep a consistent parameter convention, keep the preferred canonical obvious, and put only canonical URLs in your sitemap. Nofollow does not stop crawling, and robots controls crawling but does not decide canonicals.
Two more checks while you are here. Google recommends plain HTML links that crawlers can follow, and Googlebot does not use your search box, so a product reachable only through site search may never be found that way. And when a URL returns a success status while showing an empty or "not found" state, that is a soft 404. Record it as a technical finding, not as decay.
You know this step is done when every category candidate has a copy assessment, a grid and inventory state, an internal-link check, a facet inventory, a canonical and sitemap check, and a plain note on whether it is a useful page or a technical URL pretending to be one. That last line is what separates real category page decay from a housekeeping job.
Step 7: Audit blog pages for intent, freshness, and the path to product
Blog pages get the same comparisons, plus an editorial read. For each declining post, look at:
- Which queries lost impressions, clicks, or position
- Whether the page still matches what the searcher wants
- Whether newer competitor pages answer the question more completely
- Whether product names, prices, availability, specs, or picks are out of date
- Whether it overlaps another post and split the query cluster
- Whether its internal links still point at relevant products and categories
- Whether the drop recurs every year
- Whether the title and snippet still promise what the page delivers
- Whether conversions and assisted conversions moved with the traffic
Then check the page's change history, because timing settles most arguments. If the decline started before your last edit, the edit did not cause it. If it started the day a template, title, redirect, or canonical changed, you have a technical event, not a writing problem.
One more distinction that matters for a store. A blog post can be healthy as an information asset and weak as a commercial bridge. Record both. Not every post needs to sell, and forcing a how-to article to behave like a product page usually makes it worse at both jobs.
Common mistake: bumping the publish date and calling it a refresh. If the answer did not improve and the product facts were not verified, nothing changed except a number.
When the audit does surface a post that genuinely needs rewriting, that is where DeepSmith's Content Studio comes in. The Writer turns a planned idea into a researched, brand-grounded article with internal and external links, metadata, and a cover image already in place, so a confirmed content gap does not sit in your backlog for a quarter.
Step 8: Package the evidence and hand it off
One row per candidate, with enough evidence that someone else can act on it without redoing your work. Here are the columns worth keeping:
| Field | What to record |
|---|---|
| Identity | Canonical URL, page type, SKU or category or topic, owner, template |
| Comparison | Current and comparison windows, sample sizes, seasonality reference period |
| Search performance | Clicks, impressions, CTR, average position, lost queries, brand and non-brand split |
| Analytics | Organic sessions, engaged sessions, engagement rate, purchases, revenue, assisted conversions |
| Ecommerce state | Stock, preorder or backorder, price, product count, variant state, feed agreement |
| Technical state | Status code, indexability, canonical, sitemap inclusion, internal links, facets, tracking notes |
| Content state | Last real update, intent match, uniqueness, outdated facts, competitor or cannibalization notes |
| Diagnosis | Seasonal, availability, demand, technical, SERP or CTR, competition, content, mixed, insufficient data |
| Confidence | High, medium, or low, with the reason |
| Handoff | The evidence packet and the team that owns the next decision |
Save the before-and-after date ranges, the exact page and query filters, and the inventory state at the time. Annotate launches, template changes, price changes, stock changes, campaigns, and content edits. Future you will be able to tell cause from coincidence, which is most of the value of an ecommerce content audit in the first place.
Then set the rhythm. A light scan monthly, a deeper audit quarterly, and a check on your seasonal page groups around their demand cycle instead of once a year.
You know this step is done when anyone can open a row and answer: what fell, over what period, how big was the sample, did seasonality explain it, what was true of the product or category at the time, and who owns what happens next.
What to do next
You do not have to audit the whole catalog this week. Pick one page type, run steps 1 through 4 on it, and see what survives. That alone will tell you whether you have a content problem, a stock problem, or a seasonal chart doing exactly what it does every year. An ecommerce content audit gets easier every time you run it, because the sheet you built once is the sheet you reuse.
Then take the rows that came back as real content findings and do something with them. If producing the refreshed article is the part that always slips, DeepSmith gives you a 7-day free trial with no long-term contracts, so you can see what a publish-ready piece looks like against your own audit list. Start your free trial and turn one finding into a published page.