If you pull up your referral reports and see almost all of your AI search traffic coming from desktop, you are not reading a broken dashboard. BrightEdge, a search-data company that analyzed referral traffic across leading AI platforms, reported desktop shares between 91% and 96.5% for ChatGPT, Perplexity, Bing, and Gemini in mid-2025. That is the AI search device split marketers keep bumping into, and it runs almost opposite to what you would expect from years of mobile-first search advice.
This piece walks through what that number actually measures, how it compares platform by platform, why the gap may exist, and where that leaves your testing priorities. The short version: desktop is where measurable AI search traffic shows up right now, but that is not the same claim as "mobile AI usage is negligible," and treating the two as identical will cost you.
What the 90% Number Actually Measures
The 90% figure you have probably seen floating around describes AI search referral traffic, meaning visits that landed on a website after a click from an AI platform's answer or citation. It does not describe every prompt typed into ChatGPT, every session inside a native AI app, or every question asked of an AI assistant. Those interactions can happen entirely inside the AI interface, with no click to an external site at all, and referral analytics simply cannot see them.
That distinction matters because it changes what you can safely conclude. "Most measurable AI-referred visits to websites came from desktop" is well supported. "Ninety percent of people use AI search on desktop" is not, because a large share of AI search mobile usage may never generate a referral in the first place. Keep that line in mind anywhere you see the 90% number repeated without qualification, because most of the coverage drops it.
How AI Platforms Compare, Platform by Platform
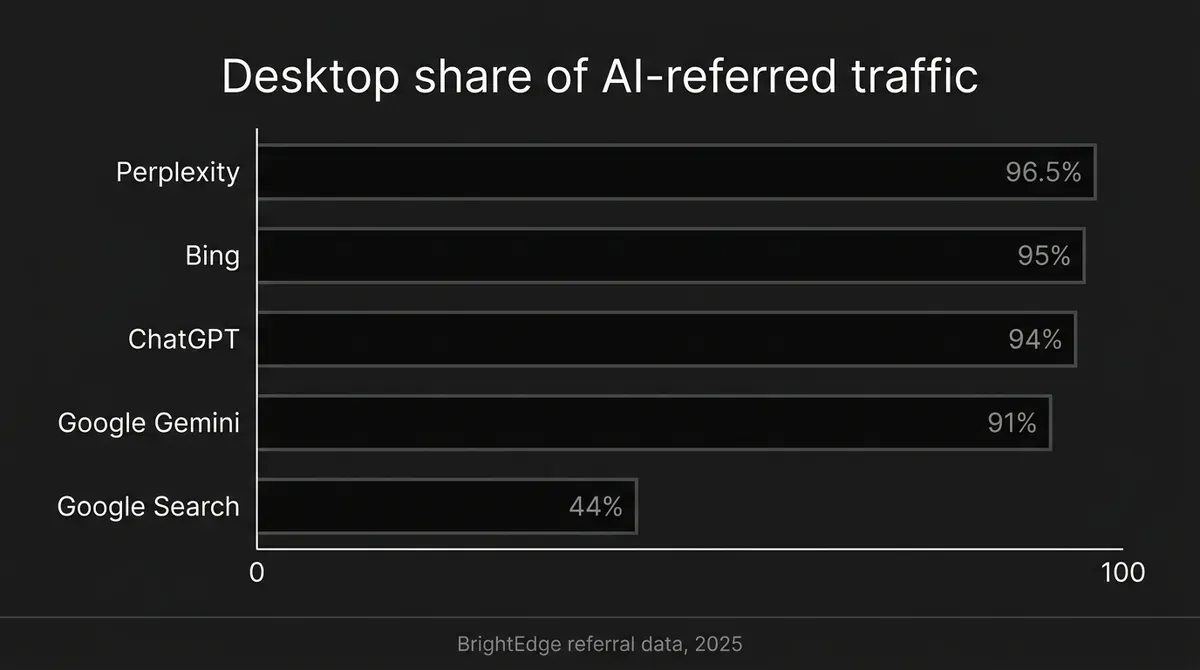
BrightEdge published its most detailed numbers in a July 2025 Search Engine Journal article by co-founder Lemuel Park, drawing on the company's Generative Parser data across the United States and Europe. The device split by platform:
| Platform | Desktop | Mobile |
|---|---|---|
| Perplexity | 96.5% | 3.4% |
| Bing | 95% | 4% |
| ChatGPT | 94% | 6% |
| Google Gemini | 91% | 5% |
| Google Search | 44% | 53% |
Every standalone AI platform in that table sits above 90% desktop for referral traffic, with Perplexity the most lopsided. A separate BrightEdge press release from June 2025, describing April 2025 data, states the same ChatGPT desktop vs mobile split of 94% versus 6%, so that particular figure holds up across two BrightEdge publications even though the reporting periods differ slightly. It is one of the more repeated ChatGPT desktop vs mobile numbers in circulation for exactly that reason.
The same pattern shows up outside BrightEdge's own numbers. Adobe ran an independent check covering November 2024 through February 2025 and found 86% of AI visit share happened on computers. That number is lower than BrightEdge's platform figures, but it points the same direction: AI referral traffic, measured by two different companies over two different windows, is strongly desktop-led. The gap between 86% and 96.5% is a reminder that these are vendor-reported figures with their own sampling choices, not a single settled constant.
Why Traditional Search Still Skews Mobile
Look at the bottom row of that table again. Google Search referrals sit at 53% mobile and 44% desktop in the same BrightEdge comparison, the exact opposite pattern from the AI platforms above it. That contrast is the whole reason the AI search mobile usage story is worth a second look: the mobile-first assumption that has shaped search strategy for a decade holds for conventional search, and does not currently hold for standalone AI platforms.
The likely explanation is maturity. Mobile browsing has been the default way people run a conventional search for years, across billions of devices and countless contexts. Standalone AI chat products are newer, and a meaningful share of their heaviest use so far has happened at a desk, doing focused work rather than a quick lookup between tasks. For context, general platform usage worldwide runs close to an even split between mobile and desktop, so the desktop lean you see above belongs to AI referral traffic specifically, not to the web as a whole.
Why the Referral Gap Might Not Match Real Usage
BrightEdge's own explanation for the desktop skew centers on how mobile AI interfaces present information. On a phone, a citation or source preview can appear directly inside the AI app or chat interface. A user can read enough of that preview to get their answer without ever tapping through to the actual website. On desktop, a citation click is more likely to open the source page directly. That difference alone can produce a heavily desktop-skewed referral count even if mobile engagement with the AI answer itself is substantial. Treat this as a plausible mechanism BrightEdge has proposed, not a confirmed rule that holds across every platform.
There is a second layer worth separating out. BrightEdge also reported that mobile AI Overviews were roughly three times more likely to appear on e-commerce queries than desktop AI Overviews (13.5% versus 4.5%), while desktop AI Overviews showed up for about 39% more keywords overall and occupied roughly 80% more screen space. Put together, that suggests mobile and desktop AI search may be developing into genuinely different experiences rather than the same experience on two screen sizes: mobile leaning toward quick, discovery-style answers, desktop toward longer research sessions that end in a click-through. That is an observed pattern, not a proven cause, so hold it loosely.
Finally, remember that "AI search" is not one thing. It covers standalone chatbot sites, native chatbot apps, AI answers embedded inside a conventional search engine, and citation links buried inside a chat response. A standalone platform's desktop-heavy referral pattern will not necessarily match an AI Overview embedded in a phone's default search app, and the public data does not currently give you a clean, single number for all of it at once.
How to Read Numbers Like These
Before you act on any of this, it helps to know exactly what you are looking at. The BrightEdge press release, dated June 2025, describes April 2025 referral data. The later Search Engine Journal article, published in July 2025, cites the same underlying BrightEdge report but describes the referral data as covering May 2025 and spanning thousands of website referrals for medium-to-large brands. Adobe's figure comes from a completely separate study window, November 2024 through February 2025. None of these three should be averaged together into one tidy "2025 number," because they measure different periods with different methods.
It is also worth noting that BrightEdge is a commercial SEO and search-data company reporting on its own analysis, not an independent academic study, and the publicly available material does not disclose a full sampling frame or industry breakdown. That does not make the figures wrong. Adobe's independent, differently sourced number pointing the same direction is a reasonable corroboration. It does mean you should cite the source and date next to any number you repeat, rather than presenting "90%" as a fixed law of AI search.
What This Means for Where You Test First
Given where the current evidence points, desktop is the more defensible place to start testing how your content performs in AI search referrals. The BrightEdge and Adobe figures agree closely enough, from two different measurement approaches, that treating desktop as the primary measurable channel for now is a reasonable working assumption, not a guess.
That does not mean writing mobile off. Keep a parallel mobile track running for three reasons. First, referral analytics can undercount mobile AI engagement whenever a user gets their answer from an in-app preview and never clicks through. Second, the device split may track query intent as much as device itself, with mobile skewing toward quick, discovery-style questions and desktop toward research-heavy ones, so your own mix of content types will shape how much mobile traffic you should expect to see. Third, Google Search itself remains mobile-majority even inside this same dataset, so anything that touches conventional search behavior still needs a mobile-first lens.
The more useful move is to stop reporting one blended "AI traffic" number altogether. Break it down by platform, by device, by whether a visit was a mention or a citation without a click, and by what happened after the visit. That is a measurement discipline, not a tool, but it is also exactly the kind of split that is easy to lose track of once you are watching five or six AI platforms alongside conventional search. DeepSmith's AI Visibility module tracks mention and citation rates per platform for the prompts you define, alongside a page-level breakdown of what is actually earning those citations, so you can see the platform-and-device pattern in your own data rather than assuming it matches BrightEdge's aggregate figures.
What Remains Unknown
The public evidence does not currently offer a single, reliable device split for every AI-search surface, every native app session, or every market. AI Overviews embedded inside a mobile search app are not the same referral pattern as a standalone chatbot site, and the numbers above describe the platforms BrightEdge measured, not AI search as a whole. Mobile interfaces and citation flows are also changing quickly, so a desktop-heavy pattern measured in spring 2025 is a snapshot, not a forecast for next year. That is one more reason to treat it as an input into your own ongoing AI visibility measurement, not a number you file away and reuse for years.
Where to Go From Here
The honest summary is this: the AI search device split is desktop-heavy right now, by a wide margin, across every standalone platform BrightEdge measured, while conventional Google Search stays mobile-majority in the same comparison. That gap is real enough to change where you look first for AI-referred traffic. It is not a reason to assume mobile AI usage does not exist, since the referral count and the real usage count are measuring different things. Start your AI-search testing on desktop, keep a mobile track running in parallel, and measure platform, device, and outcome separately rather than folding them into one number that hides more than it shows.