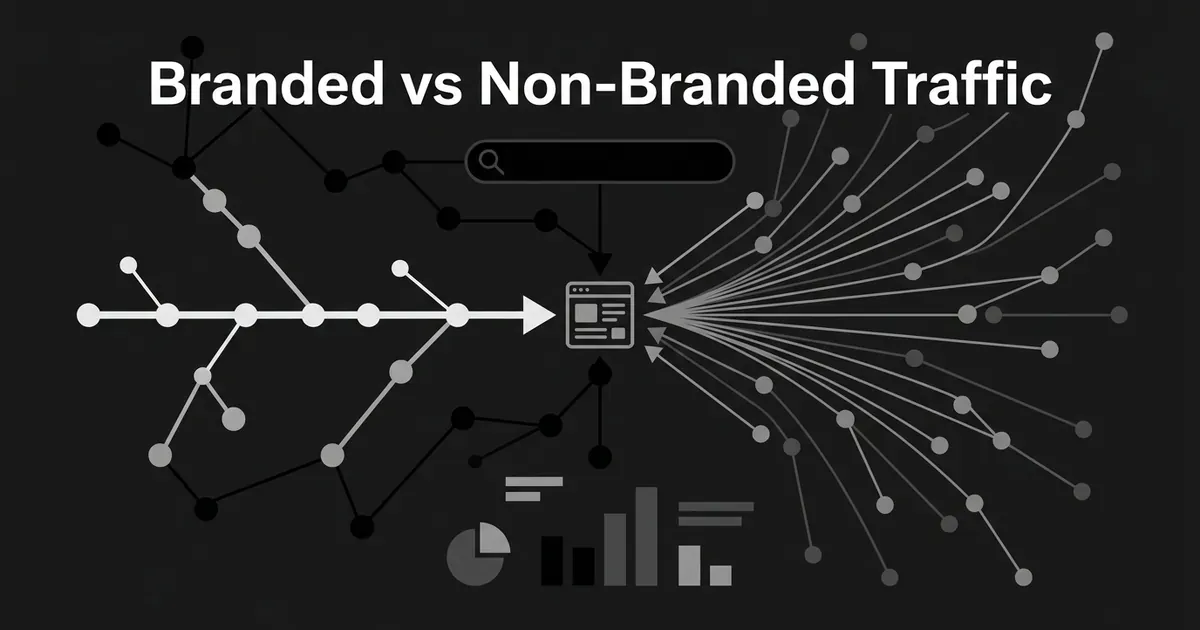
If you want to diagnose seo with branded search split, start here: branded organic traffic is the clicks that come from people who already typed your company or product name into Google. Non-branded organic traffic is everything else, the generic, problem-based, and comparison searches that never named you at all. Split your organic clicks between those two groups and you can see how much of your search traffic is demand you already had, and how much is demand your content actually went out and found.
That split does not, by itself, prove SEO is working or failing. It tells you where your organic clicks are coming from. What you do with that information is the diagnostic.
What branded and non-branded traffic actually mean
Branded traffic comes from a query that names or clearly points at your company. That includes your company name on its own, your name plus a category word ("Acme project management"), a product name that people associate with you, common misspellings, and different spacing or punctuation of your name. A query for a product that is uniquely yours, even without your company name in it, still counts as branded.
Non-branded traffic comes from a query that does not identify you at all. Things like "how to track organic traffic," "SEO reporting dashboard," or "best software for content teams." Whoever typed that search may never have heard of you before Google showed them your result. Because of that, non-branded traffic seo health is the closer read on whether your content is actually finding new people, rather than serving demand you already had.
Here is the part people get wrong most often: branded versus non-branded is a label on the search query, not a label on the page that got clicked. Your homepage can get a non-branded click if someone searched a generic term and landed there. A blog post buried three folders deep can get a branded click if someone searched your company name plus a topic. The same page can pull both kinds of traffic in the same week, and a query that mixes your brand with a category term, like "Acme pricing," still counts as branded because your name is in it.
One more thing worth separating out: if people are searching your competitor's name and landing on your site, track that as its own bucket. It is not the same as your own branded demand, and lumping it in will quietly inflate a number that is supposed to describe how well known you are.
This is really the whole question of branded search vs organic seo in one line: how much of your traffic reflects demand you already had, and how much of it your content actually earned. The same split shows up on the AI-search side too, where it is tracked as branded vs unbranded prompts rather than queries, but the underlying question is the same one.
How to measure the split in Search Console
Google Search Console is where this measurement actually lives, and as of a March 2026 rollout, every eligible property now has a branded queries filter built into the Performance report. Here is the workflow:
- Open the Search results Performance report for your property.
- Set the date range you want to compare.
- Choose Web as the search type, unless you have a specific reason to look at Image, Video, or News.
- Apply the branded query filter and record clicks, impressions, click-through rate, and average position.
- Switch the filter to non-branded and record the same four numbers.
- Compare both groups against your unfiltered total, and against an equivalent period from before.
- If a number looks off, break it down further by page, country, or device.
Google says the filter uses its own AI-assisted classification, not a simple find-and-match on your company name. It is built to catch misspellings, your name in other languages, and products that are closely tied to you even when your company name is not in the query. That also means it will occasionally get a query wrong, so spot-check a sample from each group before you present the numbers anywhere important. Pay close attention to unique product names, acronyms, brand names that are also ordinary dictionary words, and anything in another language.
The filter is not available on every property. It needs enough query and impression volume, and it only works on top-level properties, not a single subfolder or subdomain. If you do not see it, that is not proof you have no branded traffic. It may just mean your property does not meet the eligibility bar yet.
If the filter is not available to you, you can build the split by hand with a regex query filter instead. Gather your company name, product names, common misspellings, spacing variants, and any abbreviations people actually use, then write a pattern like (brand|brand product|common misspelling) with your real terms swapped in. Apply "Matches regex" for the branded view and "Doesn't match regex" for the non-branded view, using the same date range, property, and device settings for both. Search Console reads these as RE2 patterns and matches anywhere in the query by default unless you anchor it with ^ and $. Test your pattern against a real list of queries before you trust the output, because a regex only catches what you thought to include. It will miss a product name that has nothing to do with your company name, and it can accidentally sweep in unrelated words that happen to match.
Either method gives you a workable branded vs non-branded traffic split. The automated filter is easier to set up and catches more edge cases; the regex version is fully transparent and repeatable, but only as good as the term list behind it. If you build your own list, keep it versioned and note when you add or remove a term, so a jump in one group is not mistaken for a real shift in demand.
What each metric is actually telling you
Once you have both groups, resist the urge to read the split off a single percentage. Six numbers matter, and they answer different questions, a subset of the wider content performance metrics worth tracking on any content program.
| Metric | Where it comes from | What it tells you |
|---|---|---|
| Clicks | Search Console | Actual visits from a Google result |
| Impressions | Search Console | How often you showed up, not whether anyone visited |
| Click-through rate | Search Console | Whether a visible result is actually pulling clicks |
| Average position | Search Console | A directional ranking signal, not a precise rank |
| Organic sessions | Analytics | Visits recorded on your own site, after arrival |
| Organic conversions | Analytics | The business outcome, shaped by your attribution model |
Search Console measures what happened before someone reached your site: how often you appeared, how often they clicked, and roughly where you ranked. Analytics measures what happened after: whether they stuck around, what they did, whether they converted. Both are needed, and they will never match up exactly, because a Search Console click and a Google Analytics session are counted by two different systems with different timestamps, different attribution logic, and different consent rules. Google publishes its own guidance on using Search Console and Google Analytics together for exactly this reason. Say "branded share of Google organic clicks" when you are using Search Console data, and "organic sessions" when you are talking about Analytics. Treating those as interchangeable is where a lot of reporting goes wrong.
Average position deserves a specific warning. It is not a straightforward ranking number. Search Console records the topmost position your result held for every impression and averages those observations, and that average gets pulled around by search features, device, location, and whether the result was even visible on screen. Google's own explanation of impressions, position, and clicks is worth reading once before you trust the numbers here. Use it to compare your branded and non-branded groups against each other over the same stretch of time. Do not read "position 4.2" as "you rank fourth."
The two groups you built in Search Console give you the numerator for two simple formulas:
Branded click share = branded clicks / total organic clicks x 100
Non-branded click share = 100% - branded click share
Always report the raw click counts next to the percentage. A share can move in a direction that hides what is actually happening. Branded clicks can go from 2,000 to 3,000 while non-branded clicks go from 8,000 to 9,000 in the same period, both groups genuinely growing, and the non-branded share can still fall because branded grew faster. Report only the percentage and you would have called that a decline.
What a high or low branded share actually reveals
Neither a high nor a low branded share tells you SEO is working or failing on its own. Read it against the pattern it sits inside, because branded search vs organic seo is a question about the shape of your traffic, not a single winning number.
A high branded share usually means strong brand recognition and a base of people who already come looking for you by name. That is a good sign of brand health. But if branded clicks are healthy while non-branded clicks, impressions, and rankings sit flat, it can also mean you are only capturing demand you already had, without your content reaching anyone new.
A low branded share usually means people are finding you through generic and problem-based searches before they know your name, which is a genuinely positive discovery pattern for a growing site. It can also mean you have very little direct brand demand yet, which leaves you more exposed to a ranking drop, a competitor's move, or a technical problem, since you have no cushion of people coming straight to you.
The table below is a starting map, not a diagnosis you can apply blind. Match the pattern you are actually seeing, then follow the "check next" column before you draw a conclusion.
| Pattern | Likely read | What to check next |
|---|---|---|
| Branded clicks high, non-branded flat | Existing demand is carrying your traffic; discovery is stalled | Non-branded pages, topic coverage, impressions, rankings, CTR |
| Both branded and non-branded rising | Brand demand and discovery are growing together | Conversion quality, whether growth is broad or narrow |
| Non-branded clicks and share both rising | The clearest signal of real discovery growth | Landing page quality, conversions, query intent |
| Non-branded share rising only because branded fell | A percentage gain hiding a demand problem | Absolute clicks, branded impressions, campaign or seasonal changes |
| Non-branded impressions rising, CTR falling | More visibility without more clicks to show for it | SERP appearance, title and snippet, position, intent match |
| Non-branded clicks rising, conversions flat | Discovery traffic that is not converting the way branded traffic does | Landing pages, funnel stage, tracking, attribution model |
That last row is worth sitting with. Branded searchers usually arrive with stronger, more resolved intent, so a lower conversion rate on non-branded traffic is not automatically a failure. It is a different kind of visitor doing a different job. The comparison only means something once you account for that.
If several of your topics show the same flat non-branded pattern at once, that is often a signal to run a content gap analysis and see where the non-branded searches you are missing are actually going. And if it is not a coverage gap but a page that used to earn non-branded clicks and no longer does, that is worth checking against the early signals of content decay before you assume the split itself is the problem. Once you have found the page, the usual fix is to refresh old SEO articles instead of rewriting the whole section from scratch.
Why there is no universal healthy ratio
Do not go looking for the "right" branded vs non-branded traffic split, because there is not one. Your ratio depends on how established your brand already is, your business model, how competitive your category is, how often people repurchase, where your customers are located, how much you invest in advertising outside of search, and even the mix of content on your own site. A national consumer brand, a local service business, and a new software company have no business being judged against the same number.
You will run into practitioner benchmarks that put a "healthy" range somewhere around 15% to 40% branded and the rest non-branded for a growing business actively investing in SEO. Treat those as one agency's cross-section of its own clients, not an industry standard. The same is true of any claim you see that non-branded traffic makes up 80% or more of organic traffic "across most industries," or that branded searches convert two to three times better. Those numbers come from specific, limited samples and are easy to misread as universal facts. The useful version of a benchmark is your own trend, measured against your own business stage, not someone else's fixed target.
A few limits are worth knowing before you treat this split as a precise accounting of every click. Google omits some rare queries from Search Console's tables to protect the privacy of the small number of people who searched them, so your branded and non-branded totals will not always add up exactly to the unfiltered chart total. The interface caps visible rows at 1,000, and exports through the API have their own limits, which matters most on a large site with a long tail of queries. And Search Console's own history only stretches back a rolling 16 months once it is linked into Analytics, so if you need a longer view, you need to be exporting your own data regularly rather than assuming it will still be there next year.
How to tell if your SEO is actually working
This is where you actually diagnose seo with branded search split rather than just reporting it. Work through the numbers in this order, and stop as soon as you find the branch that explains what you are seeing.
Start with the absolute branded and non-branded click counts, not the percentages. Then check each group's share of the total, so you can see how the mix is shifting. Look at impressions next, to separate how often you are showing up from how often anyone is actually clicking. Check click-through rate to see whether a visible result is pulling its weight, and treat average position as background context rather than a verdict. Break both groups down by landing page, since a site-wide average can hide a page-type story, and compare across country or device if your business is split that way. Bring in your Analytics sessions, engagement, and conversions for the same period, and always compare against an equivalent prior period rather than looking at one snapshot in isolation. Note anything else that happened in that window: a campaign, a product launch, a seasonal swing, a site change, an algorithm update. Then read an actual sample of the queries themselves before you write down a conclusion. The classification tools are good, not infallible, and a few minutes reading real query text will catch a mistake that the percentages alone would hide.
The strongest simple signal that your SEO is genuinely working is non-branded clicks rising in absolute terms, alongside rising non-branded impressions, a click-through rate that is holding or improving, and more of your pages earning non-branded clicks than before. That is the read on brand traffic vs seo growth that actually holds up: not a single ratio, but a set of numbers moving together in the same direction across more than one measurement. It is also the clearest sign that non-branded traffic seo health is improving, not just shifting. More pages earning non-branded clicks across a topic, rather than one page carrying the whole group, is also one of the practical signs of topical authority building up.
Once you can see non-branded traffic actually growing on its own terms, that is also the point where it is worth connecting the split to content ROI rather than traffic in isolation, and to whether you are ready to fully commit to content as a channel.
Branded traffic tells you how much of your search demand already knows who you are before they type anything into Google. Non-branded traffic tells you how much of your search visibility is actually introducing your business to people who did not go looking for you by name. A serious read on your organic performance tracks both, but it gives non-branded traffic its own line in the report, because that is the number closest to telling you whether your content and your SEO work are actually earning new attention.