Your VP asks how content contributed to pipeline last quarter. Your stomach drops. You pull up GA4, look at the session counts, and know that number isn’t going to cut it.
I’ve had that exact moment, and it’s why I’m writing this.
Traffic is easy to measure, but it's not the number Finance or Sales actually cares about. They want to know if content helped close deals faster. If it brought in accounts that actually fit our ICP. If it kept customers from churning. Those are the real business questions, and they demand a better measurement system than just looking at website sessions.
My whole philosophy on this is simple: traffic is a weak, noisy signal. The teams that consistently prove their value and protect their budgets aren't just tracking more stuff. They're tracking the right stuff. They connect their work to pipeline and report on it in the language the rest of the business understands.
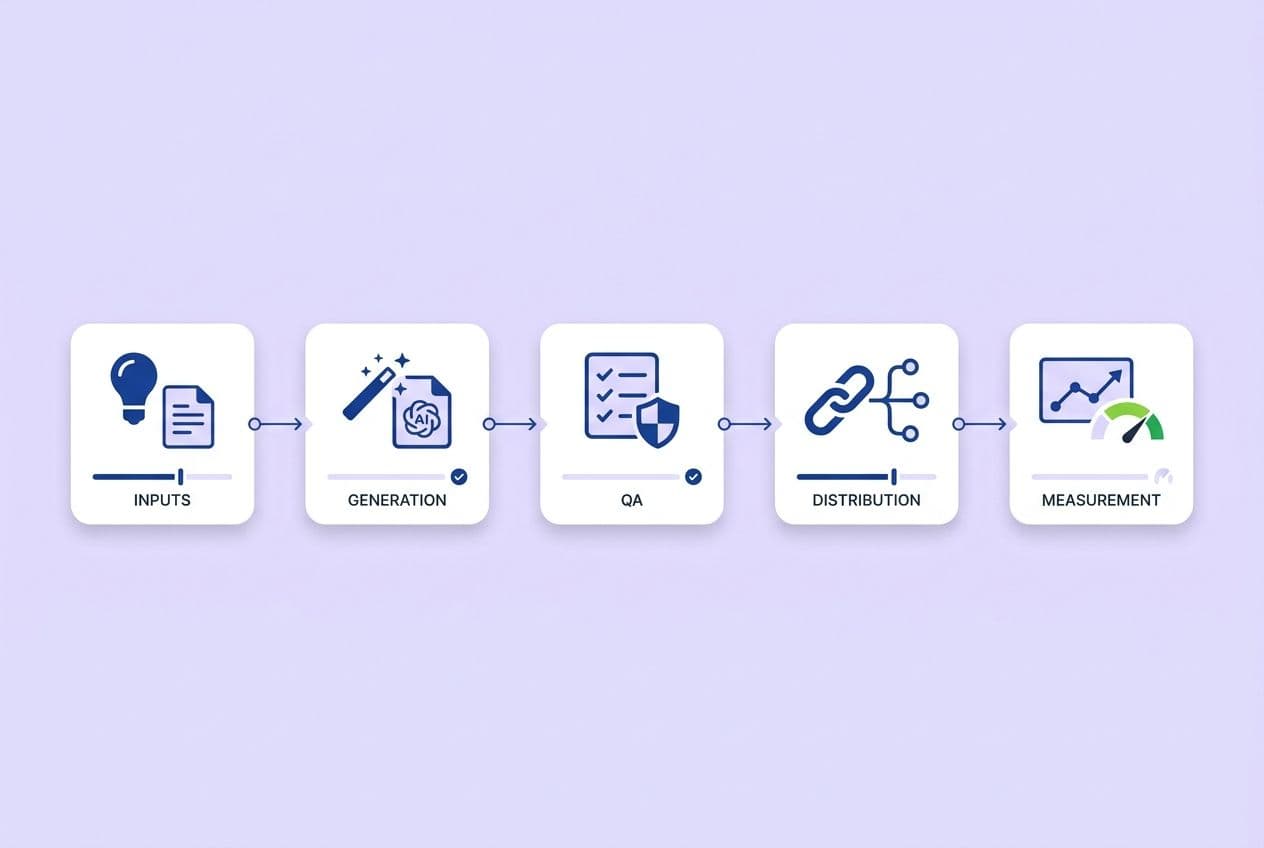
That’s a full-funnel measurement stack. And believe me, you don't need a data warehouse and a team of analysts to build one. Let's walk through it.
Why traffic is the wrong north-star for SaaS content performance (and what to measure instead)
The core principle: measure content by the business decision it supports
Here’s a rule I live by: if you can’t DO something with a number, it's just noise on a dashboard.
When you apply that filter, you realize most traffic metrics only help you answer one question: "Should I keep producing content?" The answer is almost always yes, which makes the metric kind of useless for making real decisions. It doesn't tell you what to write more of, what to stop writing, or how your work is stacking up against paid ads.
So start here. For every metric you track, write down the decision it helps you make. If you can't write anything down, stop tracking it. You're just making your life more complicated for no reason.
The hidden failure mode: optimizing for what's easiest to count
We’ve all been there. You publish a post, the traffic numbers go crazy, and you get a little dopamine hit. It feels good. But when sessions become the main goal, your team inevitably starts chasing impressions instead of intent. You end up with a portfolio of high-traffic posts that attract an audience of students and hobbyists who will never, ever buy your product.
The real pain comes later. When leadership eventually asks those harder questions about pipeline contribution or customer acquisition cost, you have no answer. That’s how content budgets get cut. It’s not because the content failed. It’s because we failed to measure what actually mattered. I've seen it happen, and it’s a terrible feeling.
What metrics matter at each stage of the SaaS funnel (a metric map you can actually use)
Here’s a breakdown of what to measure and why at each stage. And just as important, what each metric can't tell you.
TOFU (awareness): measure reach and qualified attention, not vanity engagement
At the top of the funnel, your job is simple: get in front of the right people and get them to actually read what you wrote.
Organic sessions are part of this, but you have to segment them. Overall traffic is noise. Traffic from keywords your ideal customer would actually type (think problem-aware or category-aware searches) is a signal. Pair that number with scroll depth. A high-traffic post with low scroll depth is a red flag. It tells you your intro or structure needs work. I also watch the new-vs-returning visitor ratio to make sure we're actually reaching new people.
A great, underused signal here is brand search volume. As you do better work, more people will start searching for your company by name.
What these metrics don't tell you is if the reader is in your ICP. At this stage, you’re just working with probabilities.
MOFU (consideration): measure intent and lead quality signals
This is where things get interesting. Consideration content like comparisons, use cases, or ROI calculators should produce clear signals that someone is in a buying cycle.
I look at a few primary metrics here: demo or trial requests that came from these pages, conversion rates on content downloads, and repeat visits to high-intent pages. Let's be real, someone reading your "us vs. them" pricing comparison twice in one week is not just browsing. Time-on-page suddenly becomes a lot more meaningful on these pages than on a random blog post. If conversion rates are low, it's a sign you need to clarify your value prop or CTA.
A metric most people miss is return sessions. If someone hits your comparison page on three separate days, they're probably deep in an evaluation.
What these metrics don't tell you is who that person is if they don't convert. They're invisible unless you have good remarketing or a sales-alert system set up.
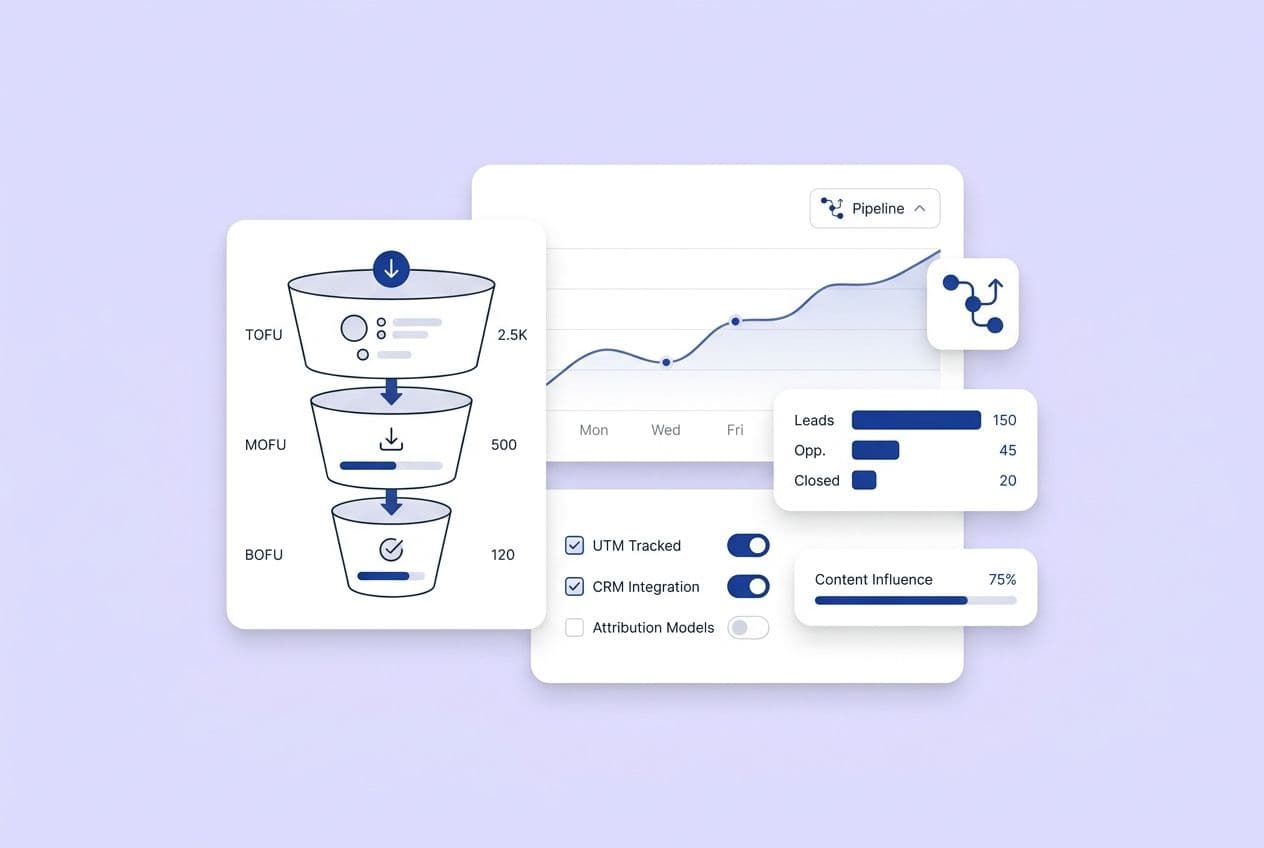
BOFU (conversion): measure pipeline creation and sales velocity influence
At the bottom of the funnel, your content is a sales tool. The metrics have to connect directly to revenue. I'm talking about:
- Opportunities created where content was the first or one of many touches.
- Pipeline value influenced (I find this is a much more defensible claim than "sourced").
- Sales cycle length for deals that touched a lot of content versus those that didn't.
- Stage conversion rates (MQL to SQL, etc.) for content-assisted deals.
This means you need a few fields in your CRM for "first-touch content," "last-touch content," and a simple "content-assisted" checkbox on opportunity records. If you see a pattern where one article is linked to deals that never move past a certain stage, it might be setting the wrong expectations.
What these metrics don't tell you is causation. Just because someone read a blog post doesn't mean it caused them to buy. Be honest about this.
Post-conversion: measure activation, retention, and expansion impact
This is the part everyone forgets, and it’s a huge mistake, especially in a downturn. If you can show you're helping keep customers, you become essential.
Track things like onboarding content completion rates, feature adoption for users who read guides versus those who didn't, and even support ticket deflection. For expansion, look at what content shows up in sales conversations before an upsell. A simple monthly Slack survey asking reps "what content helped you in expansion talks?" can give you incredibly valuable data.
A working metric map
| Metric | What it indicates | What it doesn't tell you | What to do next |
|---|---|---|---|
| Organic sessions by keyword intent | You're talking about the right things | If the visitor is a real buyer | Enrich with CRM data from any forms they fill out |
| Scroll depth on long-form content | Your content is engaging | If they'll ever come back or buy | Look at what they do next (next page, CTA clicks) |
| MOFU page repeat visits | Someone is in a buying cycle | Who that person is | Use retargeting; set up alerts for your sales team |
| Demo/trial attributed to content | You're creating pipeline | If the content was the deciding factor | Follow up with attribution interviews (just ask them!) |
| Sales cycle length by content-assisted deals | Your content is helping sales close faster | Which specific article was the most helpful | Segment by content type to find patterns |
| Onboarding content completion | Users are getting set up for success | If they are actually using the features | Connect to your product analytics if you can |
| Expansion-adjacent content usage | Your content is helping drive upsells | Direct revenue causation | Report it as "influence," not as the source |
How to connect individual content assets to pipeline (minimum viable tracking setup)
This is where the wheels fall off for most people. The ideas are simple, but getting it done is hard. Here’s the most basic setup that actually works.
Define lifecycle stages and ownership (Marketing vs Sales) before you track anything
Before you even think about UTMs, book a meeting with your head of sales. If your sales team thinks your pipeline numbers are a fantasy, it's usually because you have different definitions of what a "lead" or "opportunity" is. Agree on what action triggers each stage, what criteria moves a contact forward, and who is responsible for it. I'm not kidding, a single one-hour meeting on this can save you months of arguments.
The minimum data you need (and where it should live)
Look, you don't need a crazy data warehouse. You just need five clean, connected things:
- UTM parameters on every single link, with consistent naming.
- Form submissions that capture those UTM values and pass them to your CRM.
- A "first-touch" and "last-touch" field on your contact records.
- A "content-assisted" campaign or field on your opportunity records.
- A content source field on converted leads.
That’s the stack. With GA4 and your CRM (like HubSpot or Salesforce), this setup gives you 80% of the insight you'll ever need without hiring a data scientist.
Governance that keeps attribution clean
UTM chaos is the silent killer of content attribution. I’ve seen it a dozen times. One person uses utm_source=blog and another uses Blog, and suddenly all your reports are meaningless. Set simple rules: everything is lowercase, use hyphens instead of underscores, and keep a shared list of official sources. Document it. Check it once a quarter. It's boring, but it's essential.
How privacy changes affect your measurement stack
In a world without cookies, our old ways of tracking are becoming less reliable. This doesn't mean measurement is impossible, it just means the game has changed. Your strategy has to evolve:
- Server-side tracking: This is more reliable because it's happening on your end, not in someone's browser where it can be blocked.
- Modeled data: Tools like GA4 use machine learning to fill in the gaps from people who don't consent to cookies. It's not perfect, but it's better than nothing.
- First-party data & self-reported attribution: Focus on what you can control. Add a simple "How did you hear about us?" field to your forms. The answers you get are often more valuable than any UTM code.
What to do when content isn’t the “last click” (assist + influence reporting)
In B2B SaaS, content rarely gets the last click before a purchase. A buyer reads three blog posts, downloads a guide, goes to a webinar, talks to a sales rep, and then finally buys. Last-touch attribution gives the sales rep all the credit and makes content look useless.
The fix is simple: assist reporting. Just show how many opportunities had at least one content touchpoint in the 90 days before the deal closed. This is a defensible number showing influence. You aren't claiming content caused the deal, you're just claiming it was present and helpful. That's a story that holds up under scrutiny.
Standardize publishing inputs so tracking is consistent
If your publishing process is a mess, your data will be a mess. A page goes live without a canonical tag, a redirect is broken, a category is missing, and poof, it's invisible to your reports.
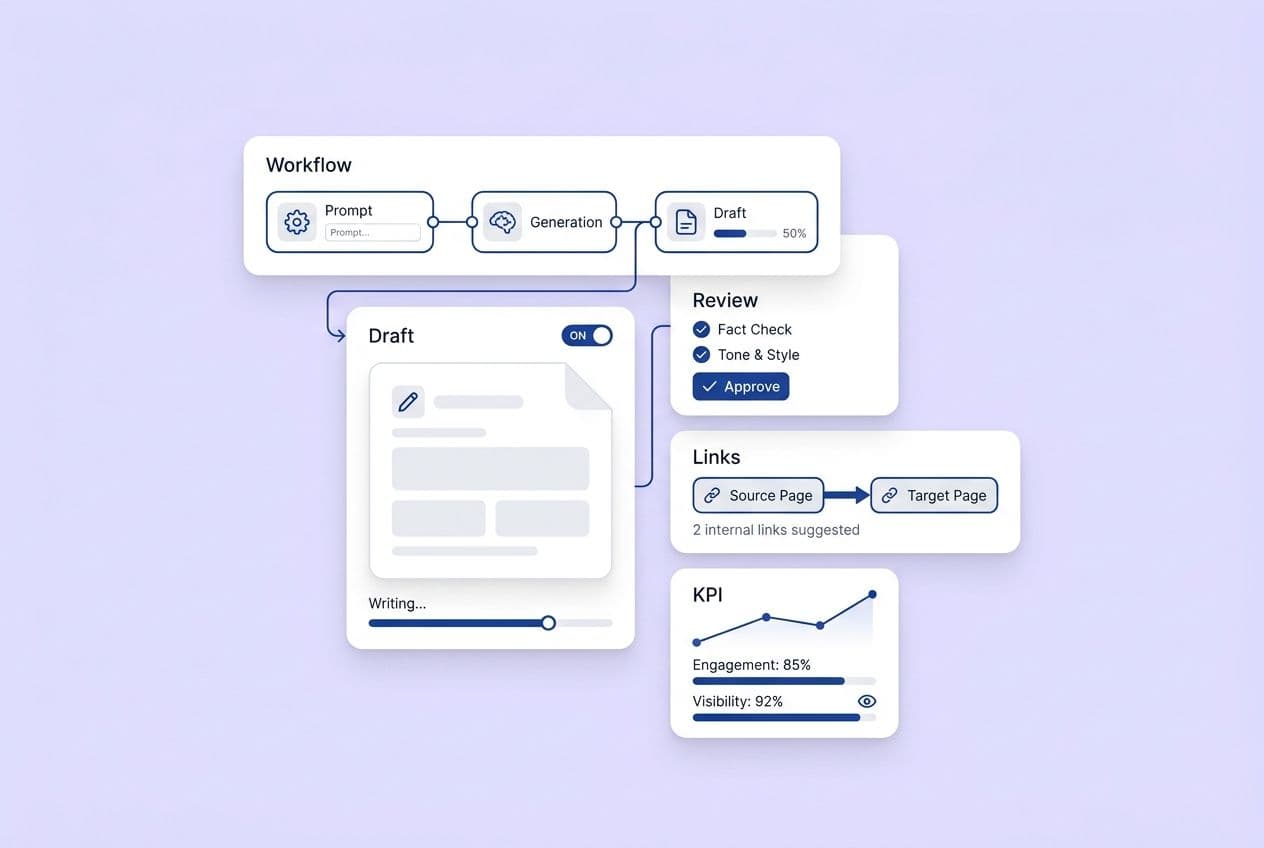
The fix is to clean up your production workflow. (Shameless plug: this is a huge reason I built DeepSmith Content Studio). We were tired of chasing down team members to get metadata right. We baked a standardized production flow into the tool, so every article gets published with the right tags, links, and tracking, automatically. Your measurement quality is only as good as your production quality.
Which attribution model should SaaS content teams use (and what each model is good for)
Why first-touch and last-touch break for SaaS
First-touch gives all the credit to the first thing a buyer ever saw, which might have been a blog post they read months ago. Last-touch gives all the credit to the last thing they did, like requesting a demo. Both are simple, but in a long B2B sales cycle with multiple people and devices, they're basically liars.
Multi-touch models in plain terms: U-shaped vs time-decay vs custom
- U-shaped (position-based): Splits credit between the first touch and the last touch, spreading the rest across the middle. This is great for sales-led motions where making a good first impression and closing the deal are both super important.
- Time-decay: Gives more credit to recent touches. This makes sense for shorter sales cycles.
- Custom/linear: Spreads credit out equally across all touches. This is the easiest to explain to your boss and a great place to start if you're not sure what matters most.
How to validate attribution so it's not just a story you tell stakeholders
Talk to your customers. Seriously. Every quarter, I get on the phone with a few new closed-won customers and just ask them: "What content did you find helpful? How did you first hear about us? What finally convinced you?" When their answers don't match what your data says, you've found a gap in your model. It keeps you honest.
Offline and sales influence: how to include what you can’t track perfectly
Digital attribution will always miss things like sales calls, trade shows, and steak dinners. If you ignore them, you're over-crediting marketing. The most pragmatic solution I've found is to just add a "marketing assist notes" field in the CRM. It lets you capture patterns ("content got us in the door, but the deal moved forward because of a referral") that make your whole story more credible.
How to measure content’s impact on retention and expansion (without pretending content “caused” renewals)
Most content teams stop measuring the second a deal is signed. This is a massive strategic mistake.
Separate support content, onboarding content, and adoption content—then measure each differently
These all have different jobs, so don't lump them together.
- Support content (your help docs) is there to reduce the load on your support team. Measure it by ticket deflection rates and the CSAT scores of people who self-serve.
- Onboarding content (setup guides) is there to get people to their "aha!" moment faster. Measure it by completion rates and time-to-first-value.
- Adoption content (use case libraries) is there to drive expansion. Measure it by engagement and correlation with high NPS scores.
Practical retention metrics content can influence
Track things like onboarding completion rate and time-to-first-value. You don't need perfect proof of causation. You just need to run a cohort analysis. Do customers who engaged with post-conversion content churn at a lower rate? That's what you're looking for.
Expansion enablement: measuring content used in upsell/cross-sell conversations
Create a Slack channel where reps can drop links to content that came up in expansion conversations. Over time, you'll see patterns like, "These five case studies show up in 70% of our upsell deals." That’s a slide worth putting in your next board deck.
Common trap: confusing “customer read it” with “content prevented churn”
Don't fall into this trap. It's tempting, but it will get you called out by your CFO. Just because a customer read a guide before renewing doesn't mean the guide saved the renewal. The right way to frame this is about influence and correlation. "Customers who engaged with our onboarding content had a 15% lower 90-day churn rate" is a powerful correlation. "Our content reduced churn" is a risky claim.
How to adapt your measurement system for PLG vs sales-led SaaS
PLG: prioritize activation, product-qualified signals, and in-product conversion paths
In a PLG motion, your product is your best salesperson. Content's job is to get people into a trial and get them to that activation moment as fast as possible. You should be obsessed with trial signup rates from content, the activation rate of those users, and the upgrade rate for product-qualified leads (PQLs) who touched your content.
Sales-led/enterprise: prioritize opportunity creation, stage conversion, and cycle time
In a sales-led world, content has to build credibility and give your reps ammo to accelerate deals. Your key metrics are opportunities with content touches, the average sales cycle length for those deals versus non-assisted ones, and stage conversion rates.
A quick reference: match your motion to your metrics
| GTM Motion | North-Star Content Metric | Supporting Metrics | Attribution Approach |
|---|---|---|---|
| PLG | Trial → Activation rate from content | Feature adoption, PQL upgrade rate | First-touch + product event data |
| Sales-led (mid-market) | Pipeline influenced, sales cycle reduction | Stage conversion, MOFU engagement depth | U-shaped or linear multi-touch |
| Enterprise/long-cycle | Opportunity creation, late-stage content assists | Executive briefing content usage, cycle time | Linear + offline influence fields |
Dashboards and reporting that stakeholders trust (and will actually use)
The 4 dashboard views you need: content health, pipeline impact, lifecycle impact, efficiency
Please, don't try to build one master dashboard. It's a recipe for confusion. Build four different views for four different audiences:
- Content health (weekly, for your team): Top pages by traffic and engagement, declining posts. This is for you to operate the program.
- Pipeline impact (monthly, for marketing & sales leadership): Content-assisted ops, pipeline influenced, MQL-to-SQL conversion by source.
- Lifecycle impact (quarterly, for CS/Product & your CMO): Onboarding completion, churn by content cohort, expansion content usage.
- Efficiency (quarterly, for Finance & your CMO): Cost per content-sourced MQL, content ROI. This is your business case.
Definitions to include on the dashboard (so Finance/Sales can't poke holes)
Every dashboard needs a little "how we define this" section. Spell out what "content-assisted" means, which attribution model you're using, and what's excluded. Your finance and sales teams can work with almost any methodology as long as it's consistent and they understand it.
Reporting cadence: what to review weekly vs monthly vs quarterly
- Weekly: Content health. Keep it operational for your team.
- Monthly: Pipeline impact. For your marketing and sales leads.
- Quarterly: The full-funnel review. For the C-suite.
And please, resist the urge to report pipeline metrics weekly. Content takes time. Reporting on it weekly will just drive you and everyone else crazy with the noise.
Common reporting pitfalls that kill credibility
I've made some of these mistakes myself, so learn from my pain:
- Focusing on vanity metrics: Don't be the person bragging about traffic while the pipeline is flat.
- Using inconsistent definitions: Don't change what an "MQL" is from month to month.
- Ignoring sales cycle length: Don't panic when a post doesn't generate a deal in its first week.
- Overclaiming causation: Use "influence" and "assist," not "generated."
- Hiding the methodology: Be proud of how you got your numbers and explain it.
Add AI visibility to your executive view
Here’s a new one I’ve been wrestling with, and your leadership is probably already asking: "Are we showing up in ChatGPT?" Your exec dashboard should now have a section on AI visibility. Track which prompts your brand is mentioned for and how often you're cited in AI tools like ChatGPT, Gemini, and Perplexity.
This is a new, high-intent channel. We built the DeepSmith's AI Visibility — Overview dashboard for this exact problem. It has cards and charts for mentions and competitive standing, so you can add this to your reports without having to build a whole new tracking system from scratch.
Using measurement to find what to cover next
This is the holy grail, right? A good measurement system doesn't just report on the past, it tells you what to do next. When your reports show that every deal you close in a certain industry involves one particular case study, you should probably create more content for that industry.
This is how you connect measurement back to strategy. When you feed these performance insights back into your editorial calendar, you stop guessing and start building a real content engine. Our DeepSmith Topics and AI Visibility — Competitors tools were designed to do exactly this, helping you find gaps and see what's working for others.
Build your content measurement system (and keep it sustainable)
Okay, I know this is a lot. Most people read an article like this, feel inspired, then look at their messy UTMs and give up. That's normal. Don't try to do it all at once.
If you do nothing else, just do these three things:
- Get sales to agree on your lifecycle stage definitions.
- Create a one-page document explaining your UTM naming rules and enforce it.
- Build one simple report: content-assisted opportunities and pipeline value influenced.
That's it. That's enough to start having a real, credible conversation with leadership. You can layer on the other stuff later.
And remember, your measurement system is only as good as your production system. If your publishing process is chaotic, your data will be too. Standardizing your workflow (with a tool like our DeepSmith Content Studio or just a better checklist) is the foundation for reliable tracking.
The goal isn't a perfect, flawless dashboard. It's a system you can defend, improve, and use to make smarter bets. That's how you earn trust and build a content program that lasts.