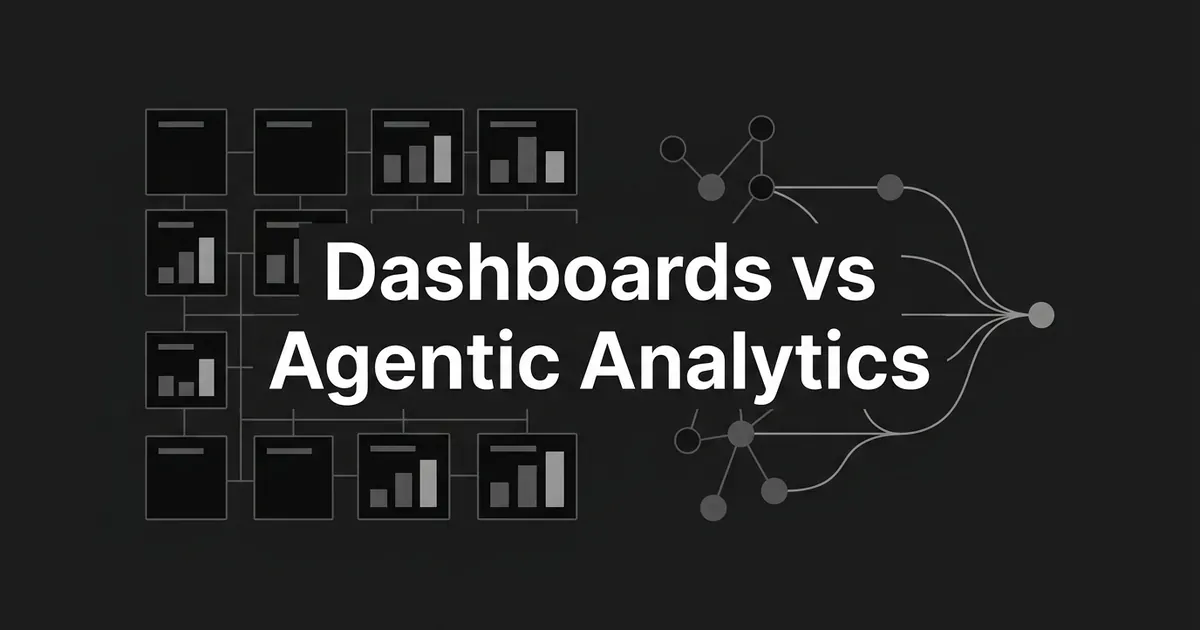
If your team spends more time explaining a number than looking at it, that's the signal worth paying attention to. Traditional BI dashboards answer known questions with curated metrics, charts, filters, and threshold alerts. Agentic analytics uses AI agents to monitor your data, investigate a question across sources, and hand back an explanation instead of just a chart. The real difference in the agentic analytics vs BI question isn't "charts versus AI." It's who starts the work: a person opening a dashboard, or an agent that noticed something on its own.
Here's the one-sentence version. Keep your dashboard when the team needs trusted, repeatable views of known marketing KPIs. Add agentic analytics when the cost of manually finding, investigating, and explaining changes gets bigger than the cost and risk of letting governed AI do some of that investigating for you. Most teams land somewhere in between, not at either extreme.
| Traditional BI dashboard | Agentic analytics | |
|---|---|---|
| Starting point | A known KPI or recurring question | A question, a scheduled scan, or an anomaly |
| Main action | Open, filter, drill, compare | Ask, review an investigation, approve |
| Analytical path | Built in advance by a dashboard builder | Planned by the agent as it goes |
| Output | Charts, tables, threshold notices | Explanations, hypotheses, recommendations |
| Best question | "What were paid conversions by channel last week?" | "Why did qualified pipeline from paid search fall?" |
What a traditional BI dashboard actually does
A dashboard is a reporting system built around modeled data: defined metrics, visualizations, filters, and recurring delivery. You generally know what you want to monitor before you open the tool. Data gets pulled from your ad platforms, web analytics, CRM, product analytics, and revenue systems into a warehouse or a BI-managed dataset. Someone on the team, an analyst or a BI developer, defines the dimensions, measures, joins, and dashboard logic. From there, stakeholders open the dashboard, apply filters, compare periods, and read the trend lines. A scheduled refresh keeps the numbers current, and if something crosses a line you configured, an alert tells you.
That last part matters more than it sounds like. Power BI and Tableau both support threshold-based alerts on top of dashboards, so "traditional" here doesn't mean static or dumb. Modern dashboards refresh automatically, take natural-language questions, and query live sources. The word "traditional" in this comparison means the dashboard-centered operating model, where a person decides what to check and when. It's not a stand-in for an outdated product category.
The strength of this model is consistency. Everyone looking at the dashboard sees the same metric definitions, the same time window, the same approved view. It can sit in a weekly meeting, get exported to a deck, or get subscribed to by anyone who wants a copy in their inbox. When your team asks the same handful of questions every week, spend by channel, pipeline by campaign, conversion rate by landing page, a dashboard is the tool built for exactly that job.
What agentic analytics adds on top of that
Agentic analytics describes an AI-driven approach where one or more agents sense a question or a signal in the data, plan out analytical work, pull from governed sources, run the queries, check the results, and hand back an explanation, a recommendation, or in some setups, an action. Databricks frames it as a closed loop: the system continuously senses, analyzes, and responds to changing data, rather than sitting still until someone opens a report.
A few properties separate this from a fancier dashboard. The system is goal-directed, meaning it's working toward answering a question rather than just rendering a tile you asked for. It can break a broad question into smaller ones, check more than one source, and refine what it's looking at as it goes. It can start on its own, from a scheduled scan or a detected anomaly, instead of waiting for someone to log in. And the output looks different too: instead of a chart, you get a narrative describing what changed, where, and what might have caused it.
Worth being precise here, because "agentic" gets stretched to cover a lot of things it shouldn't. A chatbot that turns your question into a chart is a genuine interface improvement, but it's often still reactive and single-step, which isn't the same as agentic investigation. Google Cloud's conversational analytics tooling, for example, lets you ask a data question in plain language and get an answer back from a connected data product, which is useful, but it's not automatically the multi-step, self-initiated investigation this comparison is about. Look for autonomous monitoring, multi-step reasoning, and defined action boundaries before you call a tool agentic analytics marketing teams can rely on. Otherwise what you're evaluating is really an AI analytics vs dashboards question, since agentic analytics is the narrower category sitting inside the broader one.
Known question or open-ended investigation
This is the cleanest way to sort a given piece of work into one category or the other. A dashboard is the stronger tool when the question repeats and the answer comes from the same definitions every time: spend and CPA by channel, weekly pipeline by campaign, website conversion rate by landing page, monthly budget pacing against plan. The value there is that everyone is looking at the same thing, checked the same way, every time.
Agentic analytics earns its keep when you don't know in advance which dimension or source is going to explain what happened. "Why did paid search leads fall this week" isn't a dashboard question, it's an investigation, because the answer could be in the campaigns, the landing pages, the audience mix, or somewhere in the CRM you'd have to go dig through by hand. The agent shouldn't get credit just for turning a sentence into a chart. The real value shows up when it chooses which steps to take, checks related data on its own, and weighs a few competing explanations before it answers.
Monitoring and alerting versus actually investigating
Dashboards already do a basic form of automation through threshold alerts: spend crosses a budget limit, conversion rate drops below a floor, a tile hits a number you set. That's genuinely useful, but a threshold alert answers one narrow question: did this value cross the rule I set. It doesn't tell you what caused the change, which related numbers back that up, or what to do about it.
Agentic analytics tries to close that gap, going from detection to explanation. A monitored agent notices an unusual shift, checks related breakdowns, compares time periods, and writes up what it found. Some vendors claim their systems do all of this with no prompt and no person checking a dashboard first. Treat those claims as specific to that product, not as proof of what the whole category can do, since agentic analytics isn't a single standardized spec yet.
Reporting output versus an actual explanation
A dashboard makes a pattern visible: paid social conversion rate is down, one region is behind plan, acquisition cost is up. It stops there. An agentic system tries to go further, turning that observation into something closer to a story: the metric moved by this much over this period, the change is concentrated in these campaigns or regions, related metrics support or weaken a few possible explanations, and here's a likely driver plus a next step worth checking.
Be careful with the word "explain" here, because it's doing a lot of work. An agent-generated explanation is a hypothesis, not a confirmed cause, unless something underneath it actually proves the connection. A plausible-sounding story isn't proof. If your team can't run an experiment to confirm it, language like "the data points to" or "this is worth checking further" is more honest than a flat causal claim, and it holds up better when someone questions the report in a meeting.
The data foundation neither one gets to skip
Agentic analytics doesn't remove the need for clean, well-modeled data. If anything, it raises the stakes, because an agent can move quickly through a poorly governed model and still return a confident, wrong answer. Both approaches need stable source connections, documented dimensions and measures, clear joins, consistent time zones, defined attribution windows, and a clear way of handling refunds, duplicates, and late-arriving data.
A semantic layer, the shared vocabulary that defines what "lead," "marketing-qualified lead," or "customer acquisition cost" actually means in your business, serves both a dashboard and an agent. It's not exclusive to either one. One practical habit worth keeping regardless of which tool you're using: when your ad platform and your warehouse disagree on a conversion count, don't force them into one number. The gap usually tells you something about attribution windows or identity resolution that's worth understanding on its own, and an agent that quietly reconciles two numbers that measure different things is doing you a disservice, not a favor.
Governance and how much you can trust the answer
A governed dashboard has a known owner, a visible metric definition, a fixed query path, and a refresh timestamp. That combination makes a number easy to reproduce in a leadership meeting. It doesn't mean the number is right. A dashboard can still carry a bad join, a stale refresh, or a spreadsheet input nobody reviewed.
Agentic systems add a longer list of things to govern: which tables and tools the agent can touch, which definitions count as authoritative, whether its query steps are inspectable, and whether asking the same question twice gets you the same answer. NIST's 2024 Generative AI Profile uses the word "confabulation" for AI output that confidently presents something false, and it specifically warns that generated logic or citations can make an answer look more justified than it actually is. That's the real risk in marketing reporting: a polished, well-written explanation is more dangerous than an obviously broken chart, because a broken chart gets questioned and a good-sounding paragraph often doesn't. Keep a human in the loop for anything with real budget or customer impact: reallocating spend, pausing a campaign, changing an audience, sending something external. Agentic analytics should cut down the investigation work, not the accountability.
Freshness is still bounded by your pipeline
Traditional BI freshness depends on the source, the ingestion pipeline, the refresh schedule, and how the model is built. Some Power BI setups copy source data and only refresh on a schedule, so what you're looking at can lag the source by a meaningful stretch, sometimes close to an hour in specific configurations. Agentic analytics can run more often or respond to an event, but it can't make an unrefreshed source current. Treat "real time" as a claim to verify, not a default assumption, because a fast answer built on stale data is still a stale answer.
When each approach wins
A dashboard is the right call when most of these are true: your KPIs are stable, the same questions repeat week to week, the team needs a shared source of truth more than open-ended exploration, and you need highly reproducible numbers for finance or leadership. Don't reach for an agentic layer to patch over a dashboard-design problem or an undefined metric. That's a modeling fix, not an AI one.
Agentic analytics is worth piloting when your team spends more time finding and explaining a change than reading the final report, when the answer to important questions crosses several systems, and when analysts keep running the same multi-step investigation by hand, over and over. It works best as a read-only layer at first: monitoring, anomaly triage, recurring commentary, and answering the follow-up questions that come after a report goes out. Fully autonomous budget or campaign changes are a later, separately governed step, not the starting point.
The most common answer, honestly, isn't either one alone. It's a governed dashboard as the stable operating view, with an agent layered on top to chase down exceptions, answer ad hoc questions, and draft commentary around numbers the dashboard already shows. Treating this as an all-or-nothing swap misses how most marketing orgs actually end up using both, and it's why most agentic analytics marketing pilots stay read-only and additive rather than replacing the dashboard outright.
A five-question test for your own team
Before you shop for anything, run your last month of reporting work through these:
- Are the questions known in advance? If yes, a dashboard is probably enough. If the questions keep changing shape, agentic analytics has more room to help.
- Does the work stop at seeing the number, or does it turn into an investigation almost every time? Repeated digging is the strongest signal for agentic analytics.
- Can the check be written as a stable rule? If a threshold alert would catch it, you don't need an agent for it.
- Are your underlying definitions and data actually trustworthy? If not, fix that first. An agent on top of bad data just produces confident wrong answers faster.
- What happens if the answer is wrong? The bigger the financial or customer impact, the more you need read-only operation, a visible trail of how the agent got there, and a human sign-off before anything moves.
If most of your reporting work is opening the same dashboard and reading the same numbers, you don't have a gap to fill. If your team is repeatedly pulling from four systems by hand to explain why a number moved, that's the bottleneck worth pricing an agentic analytics vs BI decision against, and it's usually a smaller, more specific gap than "we should use more AI."
DeepSmith isn't a BI tool or a marketing data warehouse, and it doesn't try to be one. Where this connects to DeepSmith's own work is a narrower slice of the same problem: instead of investigating why a metric moved inside your ad or CRM data, DeepSmith tracks how AI engines like ChatGPT and Perplexity describe and cite your brand, and turns the gaps it finds into content that closes them, all from one shared set of brand context. If your reporting gap is specifically about AI search visibility rather than campaign or revenue data, that's the corner of this problem DeepSmith is built for.