A campaign comes in under target and the first instinct is to blame whatever is easiest to see: the creative, the audience, the offer. Most of the time the real break happened somewhere else. Traffic can hold steady while qualified leads fall. Leads can hold steady while sales acceptance and revenue quietly get worse. This guide walks you through an AI campaign post mortem that finds the actual break before anyone reaches for a fix. By the end you will have a documented baseline, a funnel stage where the numbers first diverge, a short list of hypotheses backed by evidence, and an action plan you can hand to your team.
You need campaign platform data, web analytics, CRM or revenue data where it applies, a record of what changed during the campaign, and a clearly defined comparison period. If you are missing one of those, the process below will tell you where. The short version: to AI diagnose marketing performance problems well, you feed it structured evidence and a clear question, and let it help you organize the answer.
Step 1: Write One Sentence for What Actually Went Wrong
Skip the version of this where you type "why did performance get worse" into a chat window and wait for magic. Start by writing the business question in one sentence, and pin down what is in it: the campaign, channel, audience, offer, or funnel you are reviewing, the business objective, the primary outcome metric, the funnel stages that matter, the campaign period, the comparison period, the target you missed, and the decision this post mortem needs to inform.
A well formed question looks like this: did qualified leads from Campaign A fall below target during the launch window, and if so, did the decline begin at delivery, click through, landing page conversion, lead quality, sales acceptance, or revenue?
Choose your comparison baseline on purpose. Your options include the period right before this one, the same period last year, a pre campaign baseline, a matched audience, a holdout group, or a planned target, and you should be able to say out loud why you picked the one you did. Watch your dates, time zones, attribution windows, and sales cycle lag here. Comparing a two week launch window against the prior six months without adjusting for that difference will hand you a distorted answer before you have even opened the data.
Every AI campaign post mortem starts with this question, because a vague prompt gets a vague answer back. Give AI this prompt once your question is set: act as a marketing performance analyst, tell it the campaign or funnel and date range, the objective, the primary outcome and its definition, and the baseline you chose and why. Ask it to restate the diagnostic question, list the funnel stages that need examining, name the definitions that still need fixing, and specify what decision the analysis should support. Tell it not to diagnose the cause yet. You are done with this step when you have a one sentence diagnostic question, an explicit baseline, a short metric dictionary, and a decision the analysis needs to inform.
Common mistake: don't let the platform's easiest metric quietly become your business objective. A campaign optimized for clicks can post a great click through rate while sending you weak leads. State the optimization goal and the business outcome as two separate things, every time.
Step 2: Pull Every Number Into One Place Before You Ask AI Anything
Collect your evidence before you ask AI to explain anything, because a hunch dressed up as an AI answer is still a hunch. From your campaign and media platforms, gather spend, impressions, clicks, cost per click, leads or conversions, cost per lead, revenue, and whatever breakdowns the platform gives you by audience, geography, device, placement, and creative. From analytics, pull sessions, landing page views, form starts and completions, and the events that mark each funnel stage. From your CRM, pull lead status, marketing qualified leads, opportunities, pipeline value, closed won revenue, and sales cycle length. And write down your change log: every creative swap, landing page edit, budget or bid change, targeting change, tracking change, and anything happening in the market around the same window.
Then normalize it. Pick one consistent unit, such as campaign day or campaign segment day, and keep your identifiers stable across systems. Line up time zones, currency, attribution windows, and conversion definitions, because "conversion" can mean a form fill in one system and a paying customer in another, and those are not interchangeable numbers. If you use GA4, remember that source, medium, and campaign are tracked separately, and that missing UTM parameters will quietly show up as "not set" rather than throwing an error you would notice. A documented naming convention for your campaigns saves you from discovering this the hard way.
Give AI your data with a short data dictionary attached, something as simple as "one row equals one campaign day," and ask it to build a data inventory first: the grain, date range, definition, join key, and missing value pattern for every table, plus any duplicate records or incompatible definitions it can spot. Tell it not to propose causes yet, just to return a normalization checklist and a list of unresolved definitions. You are done here when every metric has a definition, every dataset has a grain and date range, and AI can tell delivery, engagement, conversion, quality, pipeline, and revenue apart in your data.
Pro tip: a short explanation of your data's shape is usually more useful to AI than a bigger export. Tell it what one row means before you hand over the file.
Step 3: Walk the Funnel and Find Where It Breaks
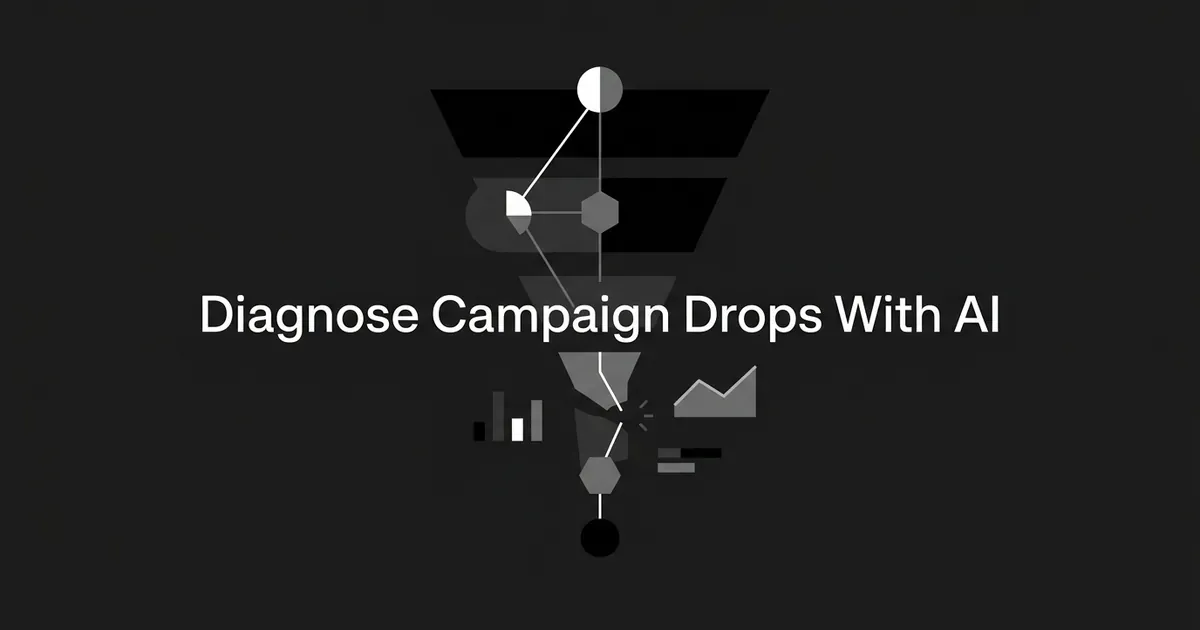
Lay the customer journey out as stages: reach, clicks or visits, landing page engagement, lead conversion, marketing qualification, sales acceptance, opportunity creation, and closed won revenue. Use only the stages that apply to this campaign. The goal isn't a complicated model, it's finding the first place where the numbers stop matching your baseline.
Calculate the conversion rate between each stage: clicks over impressions, landing page conversions over visits, qualified leads over leads, opportunities over qualified leads, and won deals over opportunities. Calculate cost at each stage too, cost per click, cost per lead, cost per qualified lead, cost per opportunity, and be specific about what goes into each number. Saying "CAC was 50" without saying whether that includes total marketing spend or ad spend alone, and whether the denominator is leads or paying customers, gives you a number you can't actually use.
If you're working in GA4, its Funnel Exploration report can show you exactly where users drop off across up to ten steps, and you can build a segment straight from that funnel to keep digging. This is where AI funnel analysis earns its keep: hand it your stage by stage numbers and ask it to build a funnel scorecard showing volume, conversion rate, change versus baseline, cost, and downstream value for every stage, then identify the first stage where things materially diverge. Ask it to flag whether that could be a true drop in user progress or a tracking and event definition problem, because those look identical in a spreadsheet and mean completely different fixes. You're done when you can point to the first affected stage and say whether the problem there is volume, efficiency, quality, or revenue.
Common mistake: don't jump from "the final conversion rate is lower" straight to "the campaign failed." That lower number could trace back to weaker reach, worse traffic quality, landing page friction, a lead quality problem, limited sales capacity, or a reporting delay that has nothing to do with the campaign itself.
Step 4: Break the Weak Stage Down Until You See the Pattern
Once you know which stage broke, cut it by every dimension that could plausibly explain it: campaign and ad group, creative and offer, audience, geography, device, placement, landing page, day of week, and for later stages, sales region or lead owner. Start broad and look for the largest meaningful difference before you slice things into dozens of tiny cells that are too small to mean anything.
For each segment, compare volume change, rate change, cost change, quality change, and its share of the total decline. A table with baseline volume, current volume, the change in both raw numbers and percentage, spend, and conversion rate next to each segment will show you the pattern faster than scrolling through dashboards.
If you're running Google Ads, its own troubleshooting guidance points at recent budget or bid changes, narrow or overlapping targeting, conversion tracking delays, ad quality and review status, and lost impression share from auction competition as common causes worth checking before you blame the creative. Treat that list as a checklist, not proof.
This segmenting step is what makes AI funnel analysis useful instead of just a summary of numbers you already had. Ask AI to segment the affected stage by campaign, audience, creative, placement, device, geography, and time, and rank the segments by how much they contribute to the total decline, not by the most dramatic percentage swing. Ask for the top five segments with the evidence behind each one and the next check needed to confirm it. You're done when you know whether the drop is concentrated in one segment, spread across the whole campaign, or caused by something touching your entire measurement setup.
Common mistake: a segment that dropped 90 percent but only had ten visitors matters less than a segment that dropped 10 percent but carried most of your volume. Ask AI to rank by contribution to the total change, not by whichever number looks the most dramatic.
Step 5: Ask AI to Rank What Could Be Causing It
Give AI everything you've built so far: the baseline, the funnel scorecard, the segment table, your change log, and any platform diagnostics. Ask for hypotheses, plural, not one confident story wrapped in AI language.
A useful root cause tree covers several categories. Measurement and data: a tracking tag failure, inconsistent UTMs, duplicate records, an attribution window change, or delayed reporting. Delivery and media: a budget limit, a bid change, audience overlap, or a policy issue. Message and creative: weak message to audience fit, an offer mismatch, or creative fatigue. Experience and conversion: landing page friction, a broken form, or a page speed problem. Market and business context: seasonality, a pricing change, or competitor activity. And a category worth naming on its own, because it's easy to overlook: whether the traffic that did arrive found content that actually answered what they were asking, or whether a competitor is simply more visible right now in the AI answers your buyers are reading before they ever reach your site.
This category by category breakdown is the real work behind any attempt to AI diagnose marketing performance problems, since a single guess rarely covers what's actually going on. Ask AI to build a hypothesis table with columns for the hypothesis, evidence supporting it, evidence against it, the data still needed, the fastest test that would tell them apart, and a confidence label like supported, plausible, weak, or not testable yet. Tell it explicitly not to use causal language unless the evidence actually supports it.
Use the Five Whys when the problem looks like a chain of operational failures, and a category based breakdown like this one when several things could be contributing at once. Keep the review blameless: you're looking at systems and decisions, not people. A strong root cause statement reads like this: the decline in [outcome] began at [stage] after [change], was concentrated in [segment], and is consistent with [mechanism]. The evidence currently supports [confidence level]. The next test is [test], owned by [owner], by [date]. "The creative was bad" is a judgment. That sentence is a diagnosis. You're done here when you have a short ranked list of hypotheses, each tied to real evidence and a test that could rule it out.
Step 6: Don't Let a Correlation Pretend to Be a Cause
This is the step that keeps a diagnosis honest. A correlation just means two things moved at the same time, and it doesn't prove one caused the other. Attribution assigns credit for an outcome to a touchpoint inside a model you chose, and that assigned credit still isn't the same as causal impact. Incrementality asks a harder question: what additional result did this campaign actually cause, compared with what would have happened anyway? A campaign can get credit in your attribution model for conversions that would have shown up regardless.
The methods for measuring incrementality trade off cost against certainty. Randomized tests and holdouts give you the strongest evidence but take time and money to run. Model based approaches, like synthetic controls, estimate a counterfactual and scale better but carry more risk of bias from variables you didn't account for. Marketing mix modeling works at an aggregate level and can factor in seasonality and competitor activity but won't tell you much about a single short campaign. Faster proxies, like new to brand percentage or a simple baseline versus exposed comparison, are directional at best. None of them replace a real control group when the decision on the table is big enough to need one.
Ask AI to go through your post mortem and classify every conclusion as descriptive, correlational, attribution based, or causal. For anything that sounds causal, ask it to name the counterfactual backing that claim, and if there isn't one, to rewrite the statement as a directional observation and suggest the smallest test that would actually strengthen it. You're done when every conclusion in the document uses language that matches what the evidence can actually support.
Common mistake: don't let an attribution report answer an incrementality question. "This campaign received credit for 30 conversions" is a different claim than "this campaign caused 30 conversions that wouldn't have happened otherwise," and mixing the two up is how good campaigns get killed for the wrong reason.
Step 7: Turn What You Found Into Actions With Owners and Dates
A diagnosis that ends in a paragraph nobody acts on wasn't worth running. Convert your findings into a small number of actions, and give each one a problem it addresses, the evidence behind it, the specific change to make, an owner, a due date, the primary metric it should move, a guardrail metric to watch, and a date to review it.
Sort actions into buckets: fix now for anything broken, like tracking or a form that silently stopped submitting; test next for hypotheses that need a controlled comparison, like creative, audience, or landing page changes; monitor for external factors like seasonality that you can't change but should watch; stop or reallocate for tactics that stay inefficient once the operational issues are ruled out; and document for whatever worked, so the next campaign starts from it instead of relearning it. A simple impact versus effort scoring method, or something like ICE or RICE, helps you rank the list without pretending the score is more objective than it is.
Time the review well: within five to ten business days of a campaign closing, or once pipeline and revenue have had time to settle, is a practical rule. Bring in the people who own the evidence and the decisions, marketing ops, the channel owner, creative, analytics, and sales, and publish the finished review somewhere searchable with links to the dashboards and data behind it. Turn each action into a ticket and check on it in your next operations meeting. A post mortem that nobody follows up on is a report, not a learning loop.
Ask AI to convert your findings into an action register, separated into the buckets above, with evidence, owner, due date, primary metric, guardrail, and review date attached to each one, and to flag anything on the list that your current tracking can't actually measure yet. You're done when the register has named owners, real dates, and a scheduled follow up, and when your next campaign brief already reflects what you just learned.
Where This Points You Next
Sometimes a post mortem like this one turns up something outside paid media entirely: the traffic arrived but landed on content that didn't answer what the buyer was actually asking, or a competitor is showing up more often in the AI answers people read before they ever click an ad. That's a content and visibility problem, not a media buying problem, and it calls for a different toolkit than the one in this guide.
DeepSmith's AI Visibility tracks how often ChatGPT, Perplexity, Gemini, and the other engines mention and cite your brand for the exact questions your buyers ask, alongside share of voice and sentiment, so you can see whether that's really what happened. Content Map lines your site and your competitors' sites up against a shared set of topics and funnel stages, which makes a coverage gap something you can point to instead of something you suspect. When a gap turns up, Opportunity Agents translate it into a specific content idea with the data point that justifies it attached, and Content Studio can research, write, link, and publish that piece with a cover image and metadata already in place. None of this replaces your ad platform, your analytics, or the campaign diagnosis you just ran. It picks up exactly where that diagnosis points, once you know the problem sits in what buyers find when they get there rather than in how they were delivered.
What to Do Next
Add the baseline, the metric dictionary, the change log, the AI prompts you used, the hypothesis table, and the action register to your next campaign brief before you launch, not after something goes wrong. The point isn't to produce one impressive analysis. It's to make every campaign a little easier to diagnose than the last one.

If this post mortem turned up a content or AI-search visibility gap behind the numbers, start a DeepSmith free trial and use AI Visibility to see exactly where competitors are winning the questions your buyers ask.